


Stock Market Inauguration Rally Should Be Handled With Care
Stock-Markets / US Stock Markets Jan 19, 2009 - 11:02 AM GMT

 There has been much talk about an “Obama Rally” taking place in January. Traders should be careful when entering long positions in the short-term, particularly on Tuesday.
My contention is not that a rally will NOT happen by the end of the month. Only time will tell. Right now, the market is oversold, so it is very possible that a bounce will occur sometime in the near future. What I am saying is that any rally that begins on Tuesday should be taken with a grain of salt. There are three reasons why I would be reluctant to participate in such a move.
First, as mentioned above, there has increasing coverage about the possibility of such a rally. My contrarian side tells me that if almost everyone is on board, then it is probably too obvious. This is similar to other widely anticipated rallies, such as the annual “Santa Claus Rally.”
Second, the market discounts news. We have known that Barrack Obama would be president since November. Why would the fact that he is being sworn-in change anything? This is old news! It is not known news that moves the market, but rather unexpected events.
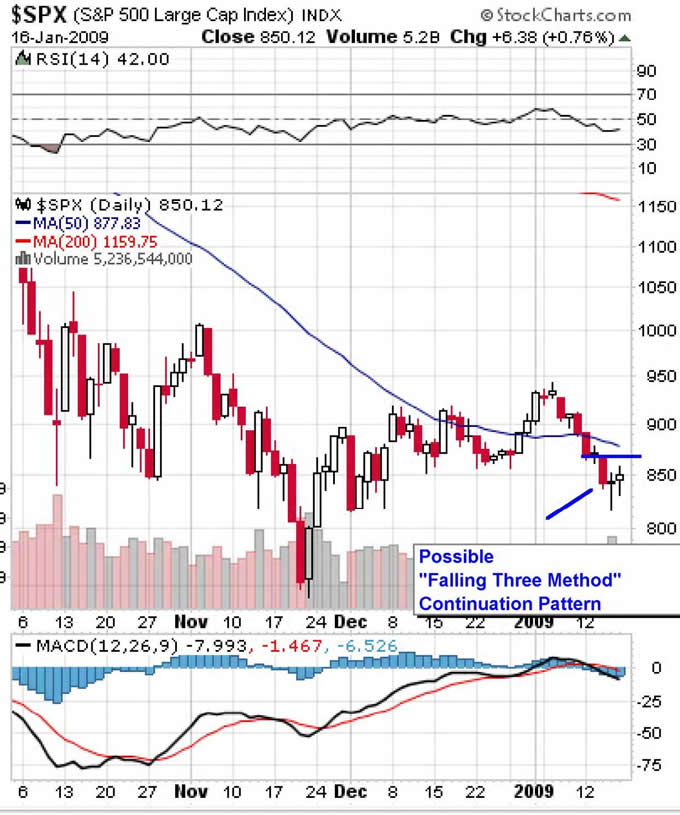
Third, the chart set-up seems to indicate a possible downside move. In candlestick charting, a continuation pattern called the “falling three method” may be forming. In the case of a downtrend, a long down candle is followed by two to three smaller bodied candles moving to the upside. If the top of the long candle cannot be breached (867 on the S&P 500 and 85.57 on the SPY), the move to the downside continues. The 50 day moving average at 877 may also act as resistance.
What does one look for on Tuesday morning? A gap-up at the open that fails to clear 867 will be a possible sign of a suckers' rally. Until the chart proves otherwise, don't believe the hype; stay on the sideline or enter short positions.
By Kingsley Anderson
http://tradethebreakout.blogspot.com
Kingsley Anderson (pseudonym) is a long-time individual trader. When not analyzing stocks, he is an attorney at a large law firm. Prior to entering private practice, he served as a judge advocate in the U.S. Army for five years and continues to serve in the U.S. Army Reserves. Kingsley primarily relies on technical analysis to decipher the markets.
Kingsley's website is Trade The Breakout (http://tradethebreakout.blogspot.com)
© 2009 Copyright Kingsley Anderson - All Rights Reserved
Disclaimer: The above is a matter of opinion provided for general information purposes only and is not intended as investment advice. Information and analysis above are derived from sources and utilising methods believed to be reliable, but we cannot accept responsibility for any losses you may incur as a result of this analysis. Individuals should consult with their personal financial advisors.
Kingsley Anderson Archive |
© 2005-2022 http://www.MarketOracle.co.uk - The Market Oracle is a FREE Daily Financial Markets Analysis & Forecasting online publication.