


Risk of China Shanghai Index Crash as Parabolic Rise Continues towards 12 Year Resistance Trendline
Stock-Markets / Chinese Stock Market Apr 23, 2007 - 06:23 PM GMTBy: Marty_Chenard

Somewhere between May 2nd. and June 14th, the Shanghai is going to do something very unusual in the realm of stock market indexes.
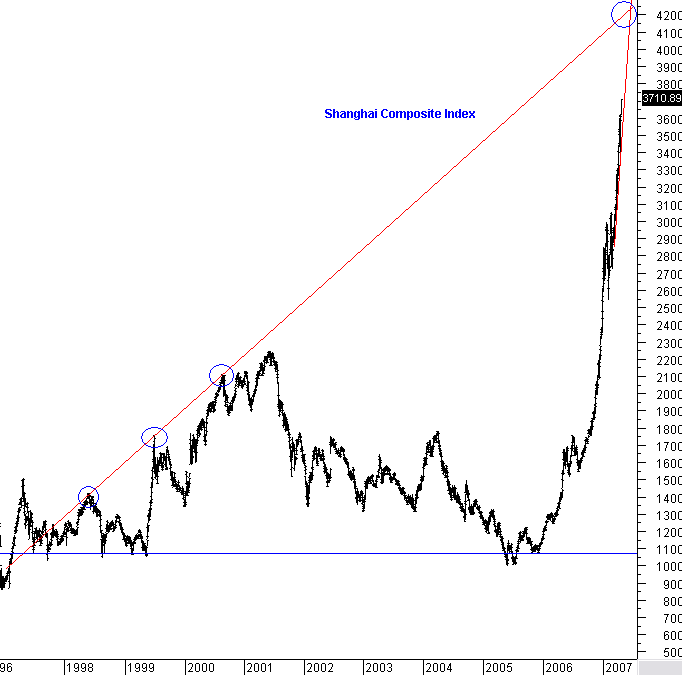
The Shanghai Composite Index has catapulted up in a parabolic trajectory that took it from 1180.96 in January of 2006 to 3710.88 this morning. That hefty 214.23% rise resulted in a hyper-parabolic rise that has the index going straight up ... and many think that there is no end in sight.
No end in sight? But, there is ... a very long, 12 year major resistance point will be reached, somewhere in between an index level of 4189 to 4231 between now and June 14th. if the Shanghai Composite just remains on its current trajectory since March 19th. of this year. Our internet bubble trajectory is being dwarfed by the speed and rise of the Shanghai Index.
The odds of a sharp reversal back down at that point is extremely high, because parabolic movements like this become exponentially more difficult as the trajectory's angle increases.
It would be a lot better for all of us, if the Shanghai corrected tomorrow morning, rather than risk a crash that would reverberate through the world indexes. The Chinese are worried that it will be the U.S. markets that take down the markets, but it is more likely that they will be the ones to take the other stock market indexes down. See the next chart ...
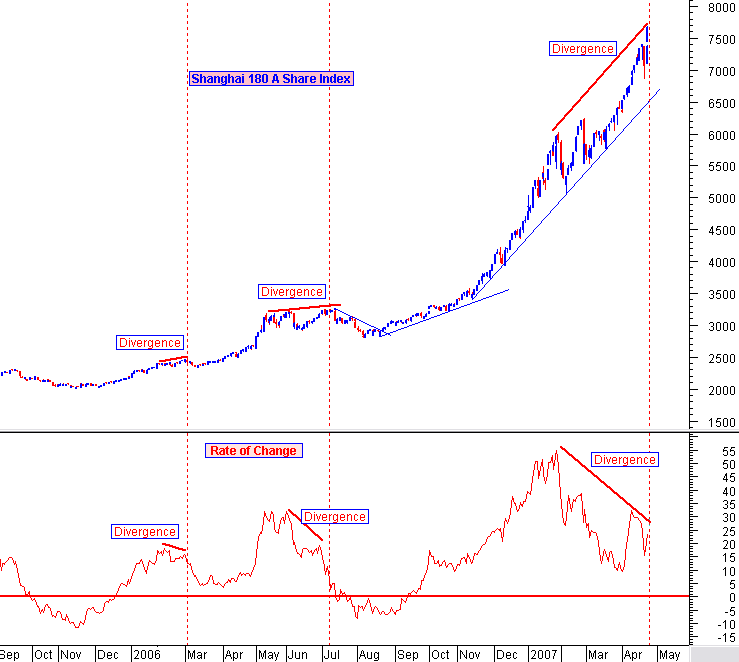
As the Shanghai Composite is going parabolic, the Shanghai 180 is showing signs of trouble ahead.
Below is the 2006 to 2007 chart for this index. What is note worthy, is that every time the Shanghai 180 has had a negative divergence with its rate of change, the index corrected. As you can see below, we now have the largest divergence disparity of the past 16 months.
In the first instance the index went up for 19 days, and then, the next 5 days of correction wiped out the entire previous 19 day up move.
In the second instance the index went up for 44 days, and then, the next 19 days of correction wiped out the entire previous 44 day up move.
What happens if this negative divergence behaves in a similar fashion? Our down side projection is at least 2000 points and over 25% to the downside.
While our economy and market may pose some downside risks due to a variety of potential problems, the biggest index related risk on a worldwide basis has to be China's stock market.
By Marty Chenard
http://www.stocktiming.com/
Please Note: We do not issue Buy or Sell timing recommendations on these Free daily update pages . I hope you understand, that in fairness, our Buy/Sell recommendations and advanced market Models are only available to our paid subscribers on a password required basis. Membership information
Marty Chenard is the Author and Teacher of two Seminar Courses on "Advanced Technical Analysis Investing", Mr. Chenard has been investing for over 30 years. In 2001 when the NASDAQ dropped 24.5%, his personal investment performance for the year was a gain of 57.428%. He is an Advanced Stock Market Technical Analyst that has developed his own proprietary analytical tools. As a result, he was out of the market two weeks before the 1987 Crash in the most recent Bear Market he faxed his Members in March 2000 telling them all to SELL. He is an advanced technical analyst and not an investment advisor, nor a securities broker.
© 2005-2022 http://www.MarketOracle.co.uk - The Market Oracle is a FREE Daily Financial Markets Analysis & Forecasting online publication.