Does Gold Price Manipulation Render Technical Analysis Obsolete?
Commodities / Gold & Silver 2009 Jan 22, 2009 - 05:11 AM GMTBy: Peter_Degraaf
 Hardly day goes by without one of my subscribers asking me the above question. In this article I will attempt to provide some answers.
The fact that manipulation exists has been well documented; first by Frank Veneroso, later by John Embry, while he was Portfolio Manager at RBC Global Investment Fund.
Meanwhile GATA.ORG this year celebrates 10 years of informing the world of the facts behind the manipulation in the gold markets. Last year they paid for a full page advt in the Wall Street Journal with the headline: “Anybody seen our gold?”
Gold is the barometer of the health of a nation's currency. When the amount of money in circulation in a particular country is steady, people tend to trust that currency and do not hesitate to hold onto it, or keep it parked in a bank account, or under a mattress. All other things being ‘normal', the price of gold as expressed in that currency will tend to hold steady, and since gold does not draw interest, people will not be tempted to rush into purchasing gold.
It is when the money supply is increasing, that people, especially those who have studied monetary history, begin to get anxious about the future purchasing power of that money, and initially some of them and eventually more and more investors begin to buy gold as protection against the price inflation that inevitably follows monetary inflation.
It comes as no surprise that central banks take an interest in suppressing the gold price, in order to be able to add money to the money supply without having the barometer that mirrors their actions (the price of gold), warn the public of their mischief.
“In 1980 we neglected to control the price of gold. That was a mistake.” Former Fed Chairman Paul Volcker.
“Central banks are ready to lease gold, should the price rise.” Former Fed Chairman Alan Greenspan during Congressional testimony July 24/1998).
The manipulation in the gold market usually occurs when the Commercial Traders (often referred to as the COT's), have accumulated a large number of ‘shorting contracts' on the COMEX. When they begin to feel the pinch of margin calls against their mounting pile of short positions, they inevitably mount a sudden assault on the gold price, with the intent of driving the price down to a point where they can cover their short positions, and start the game all over again.
Charts courtesy www.stockcharts.com

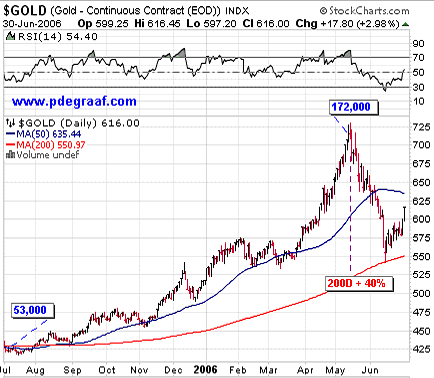
Featured is the daily gold chart from July 2005 to June 2006. In July the ‘net short' position (short positions less long positions), totaled 53,000. It should be noted that commercial traders are apt to be more often short than long, because miners tend to lock in future production. By the time May 2006 rolled around the ‘net short' position had more than tripled, and price had increased to 40% above the 200DMA. This is the kind of technical setup that appeals to whoever may be behind the manipulation in the gold price, as margin calls at this point are starting to ‘bite'. A concerted effort by the ‘shorts' to gang up on the ‘longs', together with profit taking by a number of experienced traders, was enough to stop the rally and bring price back down to the 200D.
What this chart tells us is that technical analysis was quite useful in determining that a top was due and that it was time to take profits.

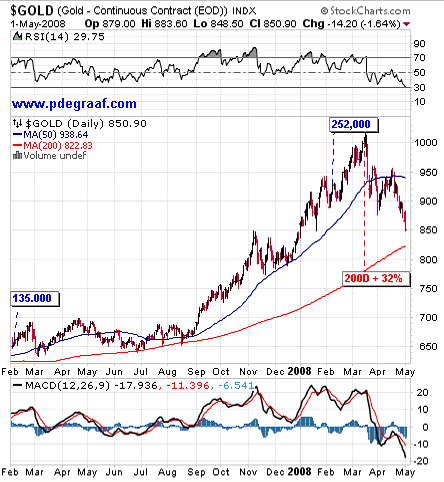
Featured is the gold price between February 2007 and April 2008. In February the ‘net short' position of commercial traders was 135,000. By March 2008 it had risen to 252,000, while price by then reached a point 32% above the 200DMA. Once again the people who are interested in keeping the gold price from rising forced gold down, and once again technical analysis was useful in warning that the market had become ripe for a pull-back.

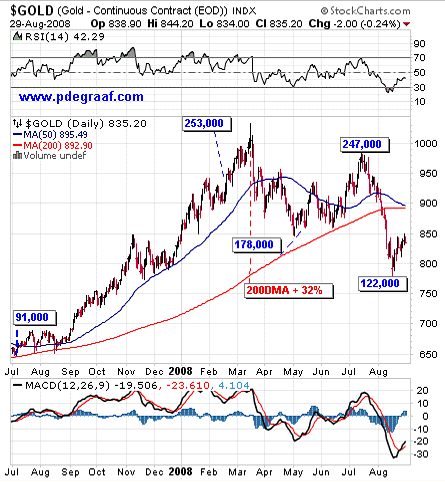
Featured is the same gold chart again, only this time with a few more months added on. We see here a repeat of the March 2008 top from the previous chart, followed by a correction that takes price back to the 200DMA in June 2008. Next we see a top in July with ‘net short' positions reaching 247,000. This total did not raise any red flags, as price back in March by comparison advanced for a few weeks, after the ‘net short' position rose to 253,000. At this point there were no ‘clouds in the sky'.
About the only technical warning sign in July 2008 was the RSI (at top of chart), which had reached ‘70'.
It took blatant manipulation in July 2008 to hammer the gold price down – well below the 200DMA where bulls could always count on support in the past. This waterfall-like price drop was caused by 3 US banks that switched from being ‘2 to 1 long to short ' in early July, to ‘22 to 1 short to long ' at the end of July. This type of action by banks that are not in the gold producing business smells to high heaven.
This is one time when technical analysis was of little use. Anyone who saw this coming was either very good, or very lucky, or ‘in with the mob'.
In conclusion: Technical analysis works in markets where there is no manipulation. It also works most of the time, even in manipulated markets, in view of the fact that the manipulators also read the charts. Historically manipulations are doomed, as supply-demand factors rule in the end. The banks tried to hold the gold price at 35.00 in 1968, and during one day in April they sold 4,000 tonnes in a vain attempt to hold the line. They failed then, and they will fail in the future.
Thus, in the words of Richard Russell: “He who buys the dips, and rides the waves will be successful.”

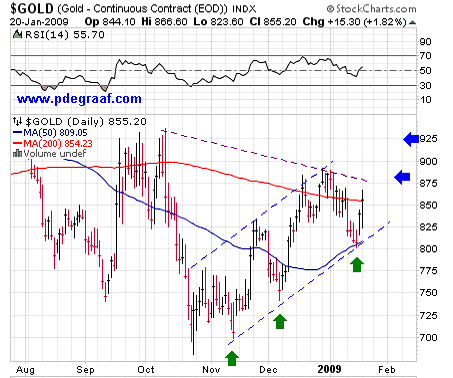
Featured is the current gold chart. The lows are getting higher (green arrows), and as soon as price works its way above the two blue arrows (where resistance is evident), the rally that started in November can be expected to rise to a new all-time high. At the blue arrows is where we can expect strong resistance from the ‘gold bears'.
By Peter Degraaf
Peter Degraaf is an on-line stock trader with over 50 years of investing experience. He issues a weekend report on the markets for his many subscribers. For a sample issue send him an E-mail at itiswell@cogeco.net , or visit his website at www.pdegraaf.com where you will find many long-term charts, as well as an interesting collection of Worthwhile Quotes that make for fascinating reading.
DISCLAIMER: Please do your own due diligence. I am NOT responsible for your trading decisions.
Peter Degraaf Archive |
© 2005-2022 http://www.MarketOracle.co.uk - The Market Oracle is a FREE Daily Financial Markets Analysis & Forecasting online publication.


