


Where is Crude Oil and USO ETF Going Next?
Commodities / Crude Oil Jan 26, 2009 - 10:18 AM GMT

 Ever since the bubble burst in Oil last Summer, OPEC has been feverishly cutting production levels. At this point, OPEC has a goal of cutting 2.2 million barrel a day for this month. However, while the downtrend in prices has slowed, why has the price not rebounded, as some might expect? Part of the reason is that the economic forecast for 2009 is still grim. The reasoning is that if the world continues to be stuck in a recession for a greater remainder of 2009, the desire or need for crude oil will decrease. Businesses will use less resources and consumers will spend less.
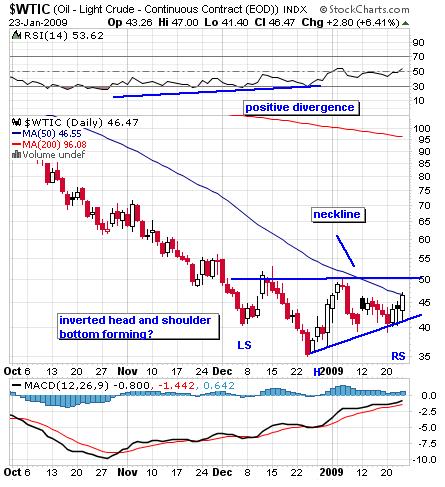
The other factor to consider is the new administration in the United States. Will President Obama manage to get both sides of the aisle to agree on a workable energy policy? Considering that most Americans have the memory of paying over $4.00 a month for gas fresh in their minds along with the tough economic conditions, this might be the perfect environment to push through comprehensive legislation. How far would he go? This is what bothers the street. The market does not like uncertainty. So, from a long-term perspective, the oil market is still operating in the dark- or is it? What does the immediate future hold for Oil? Oil is currently testing its 50 day moving average. While normally a good sign, it may also be a fake out. A negative point against this normally bullish event is that that the 50 day moving average is still pointing downward.
There are some indications that the trend may be changing. First, a lower low has been established (see the chart). While it is not much, it is a start.
Second, RSI is showing positive divergence. Normally, after a new low is made on the chart, the RSI should also make a new low. When oil made a new low in December, the RSI failed to confirm.
Third, an inverted head and shoulders pattern may be forming. A break above $50 would complete the pattern and amount to a signal to go long.
As is usually the case, the US Oil Fund chart is slightly different than the oil futures chart. An argument can be made that a double bottom has been established. RSI is also showing positive divergence. A buy signal would be generated at 38.75. However, there is some resistance in the $40 area, so it might be prudent to wait until this area is cleared.
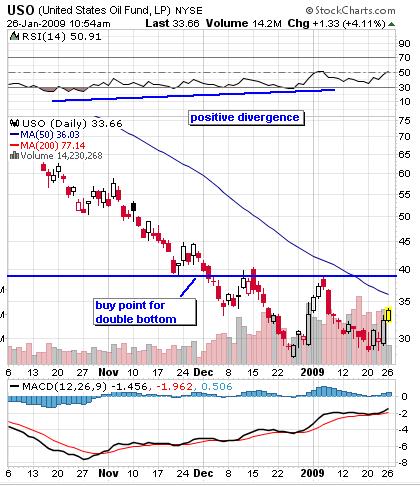
There are three places where USO could possibly be shorted: 1) If it stalls at the 50 day moving average; or 2) if it falls below 28.42 (a more aggressive short) or 3) the December low, 27.73.
While one should not ignore the fundamentals, pay particular attention to the price action. The market looks ahead. So, the new trend will be in place before fundamentals demonstrate that conditions are improving for oil bulls.
By Kingsley Anderson
http://tradethebreakout.blogspot.com
Kingsley Anderson (pseudonym) is a long-time individual trader. When not analyzing stocks, he is an attorney at a large law firm. Prior to entering private practice, he served as a judge advocate in the U.S. Army for five years and continues to serve in the U.S. Army Reserves. Kingsley primarily relies on technical analysis to decipher the markets.
Kingsley's website is Trade The Breakout (http://tradethebreakout.blogspot.com)
© 2009 Copyright Kingsley Anderson - All Rights Reserved
Disclaimer: The above is a matter of opinion provided for general information purposes only and is not intended as investment advice. Information and analysis above are derived from sources and utilising methods believed to be reliable, but we cannot accept responsibility for any losses you may incur as a result of this analysis. Individuals should consult with their personal financial advisors.
Kingsley Anderson Archive |
© 2005-2022 http://www.MarketOracle.co.uk - The Market Oracle is a FREE Daily Financial Markets Analysis & Forecasting online publication.