US Presidential Cycle Mid-term Election and the Stock Market
Stock-Markets / Forecasts & Technical Analysis Oct 22, 2006 - 02:05 AM GMTBy: Nadeem_Walayat
As the Dow Jones hits new highs above 12,000 for the first time, we take a look at what the market should be doing in terms of the long established US Presidential Cycle as we approach the Mid-Term Elections in November.
The Period November 2005 to November 2006, marks the 2nd year of the Presidential Cycle, this period is typically characterised by a general decline in optimism by investors as the president and Congress begin trying to manage difficult budget related issues and generally go about the 'boring' task of running the government.
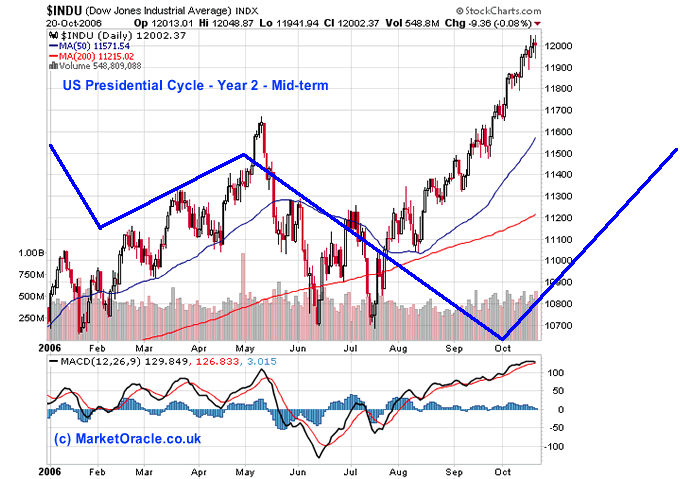
The Stock Markets actual trend this year, superimposed by the expected trend based on the average performance of the Dow Jones from 1962 to 2006. Traditionally this is the worst year of the 4 year cycle for the Stock Market. Where the Stock Market ends the year with a net loss.
The chart clearly shows the Stock Market deviating from the expected trend in August 2006, with the break higher on the back of continued earnings growth, decline in the price of Crude Oil, and the prospects that interest rates had peaked.
Historically the low during the 2nd year marks a very good buying opportunity, even though this low has come some months early, i.e. traditionally the low is made going into October, the market has performed strongly since making the low.
So how do we interpret this deviation as a sign of strength, as the market could not wait to play out the pattern before resuming the uptrend.
What about years 3 & 4 ? - November 2006 to November 2008
The second part of the presidential cycle is usually the most bullish for the stock market, in the lead up to the next Presidential Election as promises are made and the White House tends to embark on a spending spree to bring about a feel good factor amongst the electorate. The gain from the 2nd year low to the 4th year high has averaged some 35%, which would put the Dow some 2,000 points higher.
Whether it will pan out this way, we will just have to wait and see !
Nadeem Walayat
(c) MarketOracle.co.uk 2005-2006
Disclaimer - This Analysis / Forecast / Trade Scenerio is provided for general information purposes only and not a solicitation or recommendation to enter into any market position, and you are reminded to seek independent professional advice before entering into any investments or trading positions.The Market Oracle is a FREE Financial Markets Forecasting & Analysis online publication. We aim to cut through the noise cluttering traditional sources of market analysis and get to the key points of where the markets are at and where they are expected to move to next ! http://www.marketoracle.co.uk
This article maybe reproduced if reprinted in its entirety with links to http://www.marketoracle.co.uk
© 2005-2022 http://www.MarketOracle.co.uk - The Market Oracle is a FREE Daily Financial Markets Analysis & Forecasting online publication.
Comments
|
30 Oct 06, 03:21 |
Re: US Presidential Cycle Mid-term Election and the Stock Market
So i guess the stock market has moved ahead of the cycle, does that mean it will peak earlier ? |


