Emerging Markets Crumbling as Decoupling Theory Proved Wrong
Economics / Recession 2008 - 2010 Feb 08, 2009 - 09:02 AM GMT

 Asha Bangalore (Northern Trust): Significant reduction in consumer spending
“The reduction in consumer spending in the past few months is noteworthy not only because it has declined in six out of the last seven, but at the same time the savings rate has increased rapidly in an environment when income is not advancing rapidly.
“The significance of an appropriately targeted fiscal stimulus package is evident … In other words, external stimulation is necessary to offset the weakness in consumer spending because an endogenous increase is unlikely in the months ahead. A decline in consumer spending in the first quarter is nearly certain. Also, the decline will be hefty because the level of consumer spending in December was considerably large such that there is an arithmetical disadvantage also.”
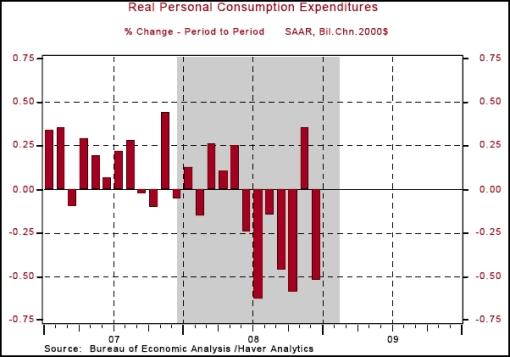
Source: Asha Bangalore, Northern Trust - Daily Global Commentary , February 2, 2009.
Asha Bangalore (Northern Trust): Factory sector - inventories/shipments ratio keeps advancing
“Factory orders fell 3.9% in December following a 6.5% drop in November, reflecting a reduction in orders of both durable (-3.0%) and non-durable goods (-4.8%). Inventories (-1.4%) and shipments (-2.9%) also declined in December.
“The most important aspect of the report is the inventories-shipments ratio which rose to 1.44 in December, up from 1.29 in September and 1.23 in December 2008. The upward trend of this ratio is consistent with the underlying weakness of the economy. The December reading is the highest since April 1996.”
Source: Asha Bangalore, Northern Trust - Daily Global Commentary , February 5, 2009.
Asha Bangalore (Northern Trust): ISM Survey - positive news, but more is necessary
“The ISM manufacturing composite index rose to 35.6 in January from 32.9 in December. The level of the index remains below 50.0 signifying a contraction in factory activity. However, the gain of the index suggests that factory activity is contracting at a slower pace in January compared with December. This is positive news.
“Indexes tracking production, new orders, and new export orders moved up in January, the employment index held steady, inventories and supplier delivers moved down. The 10.1 point increase in the new orders index warrants watching because these large jumps are associated with the end of recessions. Additional improvement in the subsequent months will be necessary to confirm that a recovery is underway given that the composite index and sub-components are far below 50.0 still.”
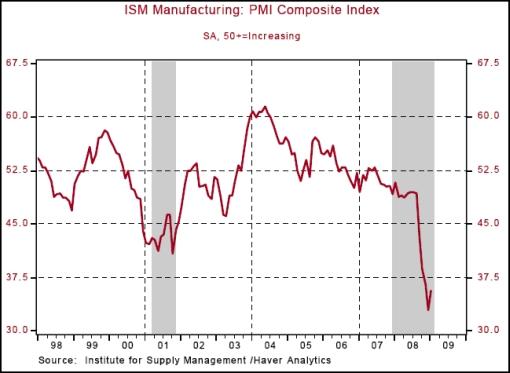
Source: Asha Bangalore, Northern Trust - Daily Global Commentary , February 2, 2009.
Asha Bangalore (Northern Trust): Second tier reports - ISM non-manufacturing survey, mortgage applications
“Second tier economic reports published today include mixed signals. The composite index of the ISM non-manufacturing survey results contained positive indications, while mortgage applications for purchase of homes fell.
“The ISM composite index of the non-manufacturing rose to 42.9 in January from 40.1 in the prior month. Although the level of the index continues to signal a contracting non-manufacturing sector, it is noteworthy because the increase suggests the pace of deceleration has slowed.
“Mortgage applications index for the purchase of homes dropped to 261.4 during the week ended January 30, the third weekly decline. The level of the index now matches the reading seen in the 2001 recession, excluding the November 2008 low.
“Although the Housing Affordability Index is at a record high, severely weak labor market conditions are holding back sales of homes.”

Source: Asha Bangalore, Northern Trust - Daily Global Commentary , February 4, 2009.
Forbes: Roubini - is America going the way of Japan?
“William Pesek, a savvy Asia columnist for Bloomberg, reports, in his latest column, views about the structural crisis faced by Japan that I first outlined in a 1996 paper, ‘Japan's Economic Crisis'. Thirteen years later, Japan is entering another severe slump, one that looks like even worse than that of other advanced economies. In the US, Europe and some other advanced economies, along with China, the second derivative of growth and of other economic indicators is approaching positive territory (i.e. growth is still negative, but GDP may be falling at a slowing rate). In Japan, it is still highly negative. There, the fall is accelerating, resembling a free fall - a severe case of stag-deflation.
“The sad case of Japan's free fall is a cautionary tale of what happens when a high-flying economy has a real estate and equity bubble that goes bust, avoiding (for too long) doing the painful structural reforms and clean-up of the financial system that is necessary to avoid a lengthy, L-shaped near-depression. Japan had over a decade of stagnation and deflation, then a mild, sub-par growth recovery that lasted only three years, and is now spinning into another severe stag-deflation.
“Keep alive zombie banks and zombie corporations with balance sheets and debts that haven't been restructured, as in Japan, and you end up in an L-shaped near-depression.
“Let me explain why the US and the global economy face the risk of an L-shaped near-depression if appropriate policy actions are not undertaken.”
Click here for the full article.
Source: Nouriel Roubini, Forbes , February 5, 2009.
BCA Research: The US economy is already in deflation
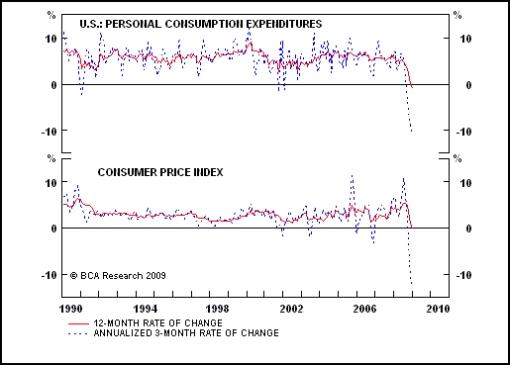
“The details of the fourth quarter US GDP data were terrible. GDP is declining in nominal terms and that is a better measure of deflation than a negative CPI rate.
“In real terms, the US economy contracted at a 3.8% annualized pace in 2008 Q4, the worst decline since 1982, but slightly better than many had expected. But the underlying picture provided no grounds for optimism. For most consumers and companies, it is the trend in nominal dollars that matters, not the statistical artifact of ‘real' dollars, measured in the national accounts. In nominal terms, consumer spending declined at an annualized pace of 11% in the three months to December - the largest contraction since the 1930s.
“Meanwhile, total final sales to domestic purchasers also fell sharply in nominal terms in the fourth quarter. Deflation is not a risk, it is a reality. Demand, profits and asset prices are all contracting in nominal terms - which is more important than what the consumer price index is doing.
“In any case, the CPI is also in deflationary territory, down at a 13% annualized pace in the final three months of 2008. The need for dramatic stimulus is obvious: declining nominal activity points to a deepening financial crisis.”
Source: BCA Research , February 4, 2009.
CEP News: US home ownership rate falls to 7-year low
“The number of Americans who own their own home fell to a seven-year low in the fourth quarter of 2008 compared to a year ago, the Census Bureau reported Wednesday.
“The rate of home ownership fell to 67.5% in the fourth quarter, down from 67.8% during the same quarter a year ago. The report also said 2.9% of homes, excluding rental properties, were vacant and on the market, up slightly from 2.8% a year ago.
“Home ownership in the US peaked at a rate of 69.2% in 2004, at the height of the real estate boom.”
Source: CEP News , February 3, 2009.
Zillow: Americans lose $1.4 trillion in home values in Q4
“Home values in the United States fell for the eighth consecutive quarter, declining 11.6% during 2008 to a Zillow Home Value Index of $192,119, according to the fourth quarter Zillow Real Estate Market Reports, which encompass 161 metropolitan areas.
“The declines mean that US homeowners lost a cumulative $3.3 trillion in home values during 2008, with much of that loss coming in the fourth quarter.
“Homeowners lost $1.4 trillion during the fourth quarter alone; more than the $1.3 trillion lost during all of 2007. Since the housing market's peak in 2006, $6.1 trillion in home values have been lost.
“Foreclosures made up nearly one in five (19.9%) of all transactions in 2008.”
Source: Zillow , February 3, 2009.
The New York Times: Rents are falling fast
“In this painful economic climate of layoffs and shrinking investments, there is a sliver of positive news: it's a good time to be a renter in New York City. Prices are falling, primarily in Manhattan, and concessions like a month of free rent are widespread.
“Although it is notoriously difficult to quantify the state of the rental market, rents fell in almost every sector of the Manhattan market last year, according to the Real Estate Group, a New York brokerage. The steepest drop was in one-bedrooms, down 5.7% in buildings with doormen and 6.53% in buildings without. The only category that rose: rents for two-bedroom apartments in doorman buildings, up just a bit, by 0.61%.
“But these numbers, like most available data, represent asking rents rather than the final price. Anecdotal evidence suggests that some people are negotiating rents as much as 20% lower than the original prices asked by landlords. These figures also leave out incentives, like a month of free rent or a landlord's paying the broker fee, which can add up to real savings.
“Fritz Frigan, executive director of sales and leasing at Halstead Property estimates that when these incentives are considered, rents are actually down some 10% to 15% since the market peak in mid-2007.”
Source: Elizabeth Harris, The New York Times , January 30, 2009.
Financial Times: S&P forecasts 200 defaults
“About 200 US junk-rated companies are likely to default this year, according to Standard & Poor's, affecting almost $350 billion worth of debt and adding impetus to alternatives to bankruptcy, such as distressed debt exchanges.
“About half of the 17 US defaults seen in December were a result of distressed exchanges, where a company offers lenders new securities of a lesser value than the debt they are owed, usually to cut interest costs or delay principal repayment.
“Debt exchanges are becoming an increasingly common way to restructure debt outside of bankruptcy in the US - they remain rare in Europe - as US companies struggle to refinance $500 billion worth of bonds and more than $1,000 billion worth of bank loans amid the credit crunch.
“S&P said that there was a higher proportion of rated companies in the single-B category than ever before, with 800 business that make up one-third of all corporate ratings. ‘We expect nearly 200 speculative-grade companies to encounter some form of financial distress, leading to default in 2009,' S&P said. ‘Currently, we have more than 180 companies rated B-minus or below with negative outlooks. That is where we expect many of the defaults will occur.'
“The agency added that the 185 companies most at risk had about $341 billion of debt outstanding. Outside the US, 61 junk-rated companies with another $56 billion worth of debt are also seen as highly likely to default.”
Source: Anousha Sakoui, Financial Times , February 2, 2009.
CEP News: US bankruptcies soar 33% in 2008
“More than 1.1 million Americans filed for bankruptcy in 2008, a 32% increase from the year before and the largest annual total since 2005, according to Automated Access to Court Electronic Records (AACER).
“Filings for companies were up 50% to 64,318, while individual filings were up 1.03 million.
“On September 15, 2008, the Lehman Brothers bankruptcy was the largest Chapter 11 filing of all-time. That was followed several days later by Washington Mutual, which became the biggest bank failure in US history.
“The largest increases in bankruptcy filings were in California (85%) and Arizona (81%), as those states also had the highest foreclosure rates.”
Source: CEP News , February 2, 2009.
CEP News: US credit card delinquencies at record high, says Fitch
“US credit card delinquencies reached all-time highs in January on the back of ongoing deteriorating conditions in the US economy, according to a study released by Fitch on Thursday.
“The rate of payments missed by more than 60 days advanced 0.47 percentage points to an all-time high of 3.75% in January, according to the report.
“‘US consumers continue to struggle in the face of mounting pressures on multiple fronts, from employment to housing to net worth,' according to Michael Dean, a managing director at Fitch.
“The news comes at a difficult time for the United States with the economy shedding more than half a million jobs per month, and no signs of a turnaround in the near term.
“In addition, the Fed has pledged $200 billion in an initiative geared at backing holders of asset-backed securities including credit card debt, education and auto loans.”
Source: CEP News , February 5, 2009.
Financial Times: CDS regulation in Europe moves closer
“The prospect of legislation which would force banks and dealers in Europe to clear their deals in the huge credit default swap market centrally moved closer on Tuesday, when a top EU regulator asked parliamentarians to support the move.
“Charlie McCreevy, EU internal market commissioner, told a parliamentary committee in Strasbourg that both the European Central Bank and European regulators considered that ‘clearing of credit default swaps on a central counterparty in the EU is essential for financial stability and oversight'.
“Talking in the context of the capital requirements directive, which is currently passing through the parliament, Mr McCreevy said: ‘I would urge the parliament to support an amendment to give effect to this'.
“The commissioner's move comes a few weeks after talks between Brussels and the industry to devise a central clearing system for the CDS market, which generally trades on a one-to-one basis between banks and dealers, broke down.”
Source: Nikki Tait, Financial Times , February 3, 2009.
Bespoke: Worst post-election day returns since 1900
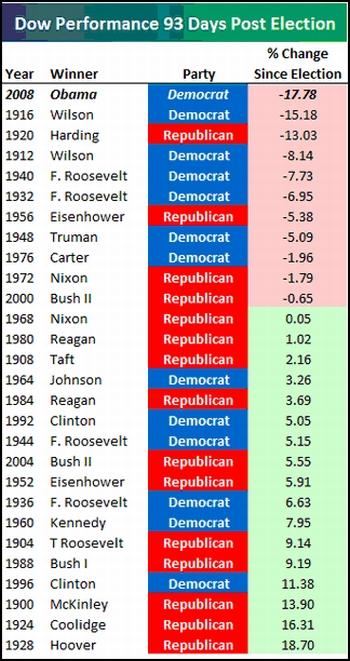
“Not many people thought that running the country was going to be an easy job for President Obama, and based on the Dow's returns since election day, the market doesn't think so either. Below we highlight the performance of the Dow this many days past election day for all Presidential elections since 1900. As shown, the Dow's decline of 17.78% since Obama's election 93 days ago is the index's biggest drop following any election in the last 108 years.”
Source: Bespoke , February 5, 2009.
CNN Money: Buffett's metric says it's time to buy
“According to investing guru Warren Buffett, US stocks are a logical investment when their total market value equals 70% to 80% of Gross National Product.

“Is it time to buy US stocks?
“According to both this 85-year chart and famed investor Warren Buffett, it just might be. The point of the chart is that there should be a rational relationship between the total market value of US stocks and the output of the US economy - its GNP.
“Fortune first ran a version of this chart in late 2001. Stocks had by that time retreated sharply from the manic levels of the Internet bubble. But they were still very high, with stock values at 133% of GNP. That level certainly did not suggest to Buffett that it was time to buy stocks.
“But he visualized a moment when purchases might make sense, saying, ‘If the percentage relationship falls to the 70% to 80% area, buying stocks is likely to work very well for you.'
“Well, that's where stocks were in late January, when the ratio was 75%. Nothing about that reversion to sanity surprises Buffett, who told Fortune that the shift in the ratio reminds him of investor Ben Graham's statement about the stock market: ‘In the short run it's a voting machine, but in the long run it's a weighing machine.'”
Source: Carol Loomis and Doris Burke, CNN Money , February 4, 2009.
Bespoke: Positive guidance at decade lows
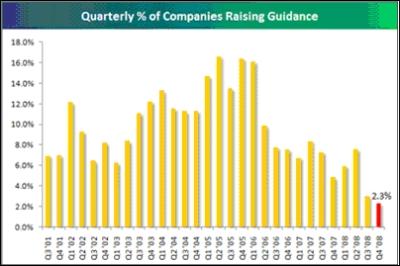
“Bespoke tracks a number of indicators during earnings season, and one of them is the percentage of companies that are raising guidance. Below we highlight this guidance indicator on a quarterly basis based on the 50,000+ individual earnings reports in our Earnings Report Database. During the current earnings season, just 2.3% of companies have raised guidance, which is the lowest reading since at least Q3 ‘01. Last quarter's reading of 3% was the lowest at the time, but unfortunately, it has gotten even worse. At least expectations are about as low as they can get, and when the time comes that companies do start besting their guidance, it should propel stocks higher.”
Source: Bespoke , February 6, 2009.
Barry Ritholtz (The Big Picture): Bad Januarys equal bad Februarys?
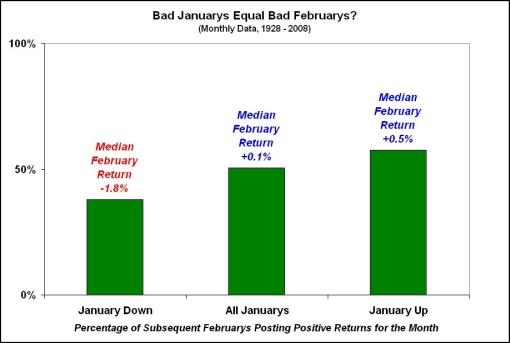
“Last month, the S&P 500 index dropped 8.6%, which was the worst January on record. Naturally, that has some people wondering if this month will be any better. Unfortunately, history suggests otherwise.
“Since 1928, the market has declined in the first month of the year on 29 out of 81 occasions, or 35.8% of the time. The median loss during those losing Januarys has been 3.8% versus an overall average gain of 1.6%.
“On balance, performance in the month after a weak January has also been a downer. Over the past eight decades, the follow-on February has seen the S&P 500 decline on 18 separate occasions, or 62.1% of the time, with a median loss of 1.8%. That compares to an average rise of 0.1% for all Februarys from 1928 - 2008.
“So, while I have been among those who have been anticipating a first-half recovery (before a resumption of the bear market later in the year), the historical record suggests I just might have to wait until this month blows over first.”
Source: Barry Ritholtz, The Big Picture , February 4, 2009.
Bespoke: Nasdaq outperforms
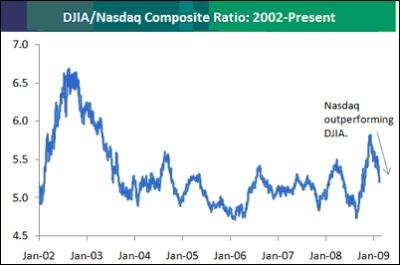
“The Nasdaq has outperformed the S&P 500 and Dow Jones Industrial Average year to date, and it is actually up on the year while the other two are down between 3.5% and 6%.
“So how does this recent Nasdaq performance affect the index's ratio with the Dow? Below is a chart of the DJIA/Nasdaq ratio since the start of 2002. When the line is rising, the Dow is outperforming the Nasdaq, and vice versa for a falling line. After getting slaughtered versus the Dow from August 2008 to November 2008, the Nasdaq has been outperforming. And judging by the range of the ratio over the past few years, this trend could continue for some time.”
Source: Bespoke , February 6, 2009.
Bespoke: US and BRIC world market share
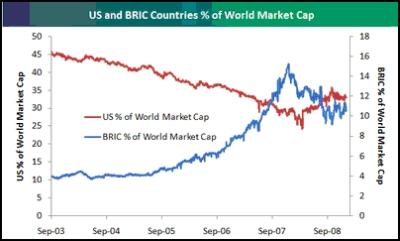
“Earlier today we released a report showing just how off the ‘decoupling' theory has been during the current global bear market. During the global bull market from ‘03 to ‘07, many pundits believed that developed and emerging markets outside of the US were strong enough to not catch a cold when the US sneezed. The BRIC countries of Brazil, Russia, India, and China were probably the most talked about countries when ‘decoupling' came up, but as we've all seen, these countries have in fact gotten hit much harder than the US during the downturn.
“This couldn't be highlighted better than in the chart below that shows both the US and the BRIC countries as a percentage of world market cap since mid 2003. As global equity markets rallied across the board from ‘03 to ‘07, the US lost a huge amount of world market share, falling from about 45% to a low of 24%. At the same time, BRIC countries went from about 4% of world market cap to nearly 16%.
“Once the credit crisis hit, however, US markets fell, but the rest of the world fell even harder. And as the chart shows, the US has been steadily gaining back market share over the last year or so, while the BRIC countries have fallen. Bear market: 1, Decoupling: 0.”
Source: Bespoke , February 2, 2009.
Bespoke: Performance of country ETFs
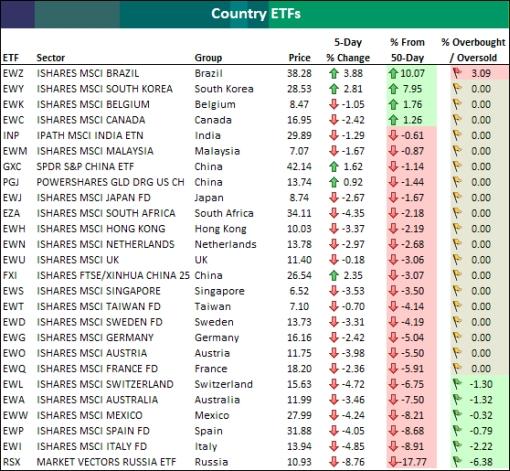
“Below we highlight ETFs that track equity markets for various countries. For each ETF, we provide its 5-day change, how far it is trading from its 50-day moving average, and how overbought or oversold it currently is. For overbought/oversold levels, we calculate how far the ETF is trading above or below the top or bottom of its trading range (using one standard deviation above and below the 50-day moving average as the trading range).
“As shown, four countries (Brazil, South Korea, Belgium, Canada) are trading above their 50-day moving averages, and just one (Brazil) is trading in overbought territory. The Russia ETF (RSX) is trading the furthest below its 50-day moving average, followed by Italy (EWI), Spain (EWP), Mexico (EWW), and Australia (EWA). Switzerland, Australia, Mexico, Spain, Italy, and Russia are all trading in oversold territory.”
Source: Bespoke , February 4, 2009.
CNBC: Dr. Doom - Asian markets pay you to wait
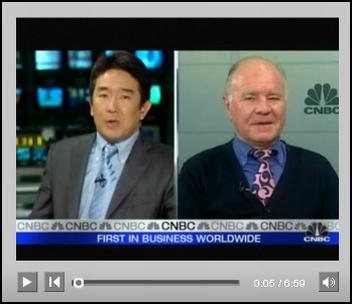
“Marc Faber, Editor of The Gloom, Boom & Doom Report, feels that the US market at current levels isn't cheap. Asian markets, on the other hand, are much more value for money - there are stocks that pay you to wait out the recession. He shares his thoughts with CNBC's Martin Soong.”
Source: CNBC , February 6, 2009.
Eoin Treacy (Fullermoney): Chinese stock market looks promising
“I find it interesting that the more sentiment deteriorates with regard to the future prospects for growth in the USA and Europe and as stock markets continue to disappoint; the same dire conclusions are rolled out to Asia and especially to China. There is no denying that the slowing global economy is having a knock-on effect in almost every country and China is no exception.
“Major job losses in Guangdong, slowing economic output, massive declines in the stock market and a peak in the housing market are seen as justifications to support this view. In addition, a communist system is by definition corrupt because it is unaccountable and concentrates power in the hands of too few people, media is heavily censored and citizens are indoctrinated to accept the status quo from an early age. However, with China, everything is seldom as it seems.
“The decline in the wealth effect in the West has been led by the fall in house prices. It is exaggerated by the home equity withdrawals which allowed home owners to leverage up their debt on the back of house price appreciation. To the best of my knowledge this option is simply not available to Chinese residents. 100% mortgages do not exist and the norm is for large down payments. The automotive loan industry is still in its infancy and credit / debit cards are used to far less an extent than in the West. It is still not surprising for large transactions to take place in cash rather than any other means. China does not have a futures market, although one is promised, and financial leverage available to retail investors is limited.
“Following a massive decline and 4-months of ranging, there has been little to encourage new money into the market. Ranging suggests supply and demand have come back into balance, but the Shanghai A-Share market needs to sustain a move above 2200 and ideally 2500 to indicate the bulls are back in control. In the short-term, the progression of higher or equal lows from the October nadir indicates that demand is returning at incrementally higher levels.
“The argument about the pace, course and impact of China's re-emergence has being going on for a number of years and will continue to spark powerful emotions on both sides. At Fullermoney, we will continue to give the greatest weight to the charts, and right now, China shows the best base formation development characteristics of any globally significant market.”
Source: Eoin Treacy, Fullermoney , February 3, 2009.
Bloomberg: Roubini - Russia, east Europe stocks face “massive” drop
“Russian and eastern European equities may fall further because earnings and other fundamental measures mean little in the current economic turmoil, said Nouriel Roubini, the New York University professor who forecast a US recession two years ago.
“‘In market dynamics, prices can move far below what fundamentals justify,' Roubini said in an interview in Moscow. ‘There is still a massive downside for equities in the region.'
“‘They may stagnate there for a while, and there's not going to be any recovery,' Roubini said. ‘For the time being, it's going to get ugly.'
“The Russian Trading System Index is trading at 0.5 times book value, or the net asset value of its 50 companies, lower than the 1.4 times book value for the MSCI Emerging Markets Index according to weekly data compiled by Bloomberg.”
Source: William Mauldin, Bloomberg , February 4, 2009.
John Authers (Financial Times): Are Tips pointing to a return of inflation?
“The deflation scare that hit the world last year seems almost to be over. But markets disagree over whether this is the prelude to another inflation scare.
“Last year, the ‘breakeven' rate at which US 10-year inflation-linked bonds (or Tips) would offer the same return as fixed-income Treasuries dipped below 0.1%. This implied there would be virtually no inflation at all, on average, over the next decade. Breakeven rates also implied there would be outright deflation over the next five years. Nothing like this had happened since the Depression of the early 1930s.
“If there was any inflation at all, this meant that Tips would outperform. Many seem to have bought them on this basis, as Tips now imply an inflation rate of 1.1% for the next 10 years. This is very low, but is its highest in four months.
“Meanwhile the real yield on conventional US Treasury bonds (obtained by subtracting current inflation from the nominal yield) is 2.8%, the highest in two years. That is in part due to low headline inflation. However, this figure makes it harder to believe US bonds are in a bubble.
“The inflation rate is fundamental to the valuation of many asset classes. Higher inflation expectations should hurt bonds and boost commodities and stocks. As it implies returning consumer activity, it should help consumer discretionary stocks most.
“Looking around the markets, there are many contradictions. Gold is gaining, but other commodities are not significantly above their lows. Stocks are not doing so well.
“An explanation might be as follows. Markets recognise that last year's deflation panic was extreme, but are still not certain that the money-printing measures will push up inflation. The Tips market is relatively inefficient, and investors took the opportunity to make money out of it - but markets could move much further if inflation returns as governments hope.”
Source: John Authers, Financial Times , February 3, 2009.
Guardian: Soros - euro may not last without global plan
“The euro may not survive unless the European Union pushes for an international agreement on toxic assets, billionaire investor George Soros told Austria's Der Standard newspaper.
“‘One would need a type of agreement on lost capital, so that the burden is shared, and in which every country is part of, otherwise more countries will suffer,' said Soros in an interview with the paper, which was published on its Website.
“‘The EU should do this. If they don't do this then the euro may not survive the crisis.'
“A warning from European Central Bank President Jean-Claude Trichet that the ECB could push interest rates below 2% and use other measures to boost growth also hit the euro, as did data showing the biggest monthly jump in German unemployment in four years.”
Source: Guardian , January 29, 2009.
Bloomberg: Ruble falls to 11-year low
“The ruble slumped to its weakest level against the dollar in 11 years as investors speculated Russia will be forced to give up its currency defense after draining reserves.
“‘The pace of the move to the target is definitely going to be a source of concern to the central bank,' said Martin Blum, head of emerging-market economics and currency strategy at UniCredit SpA in Vienna. ‘Global risk appetite is continuing to deteriorate so the pressures on the ruble will continue.'
“The ruble slumped 35% against the dollar since August as a 63% drop in Urals crude oil prices and the worst global economic crisis since the Great Depression spurred investors and Russian citizens to withdraw about $290 billion from the country, according to BNP Paribas SA.
“Bank Rossii expanded its trading range for the ruble 20 times since mid-November before switching policy to let ‘market' forces help determine the exchange rate within a widened limit.”
Source: Emma O'Brien, Bloomberg , February 2, 2009.
Ambrose Evans-Pritchard (Telegraph): Putin calls for end of dollar stranglehold
“Russian prime minister Vladimir Putin has called for concerted action to break the stranglehold of the US dollar and create a new global structure of regional powers.
“‘The one reserve currency has become a danger to the world economy: that is now obvious to everybody,' he said in a speech at the World Economic Forum.
“It is the first time that a Russian leader has set foot in the sanctum sanctorum of global capitalism at Davos.
“Mr Putin said the leading powers should ensure an ‘irreversible' move towards a system of multiple reserve currencies, questioning the ‘reliability' of the US dollar as a safe store of value. ‘The pride of Wall Street investment banks don't exist any more,' he said.
“Mr Putin said: ‘We are witnessing a truly global crisis. The speed of developments beats every record, and the strategic difference from the Great Depression is that under globalisation this touches everyone. This has multiplied the destructive force. It looks exactly like the perfect storm.'
“However, Mr Putin's own government in Russia is facing mass protest as unemployment surges and austerity measures start to bite.”
Source: Ambrose Evans-Pritchard, Telegraph , January 29, 2009.
Bloomberg: Rogers says Russia may break up
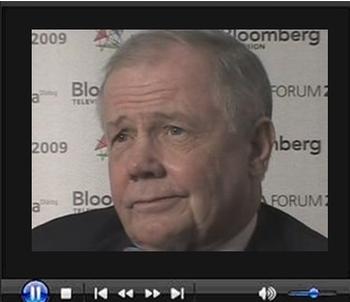
“Jim Rogers, chairman of Rogers Holdings, talks with Bloomberg's Ellen Pinchuk about the outlook for the Russian economy, the ruble and his investment strategy. Rogers, speaking in Moscow, also discusses the outlook for oil prices and emerging markets.”
Source: Bloomberg , February 5, 2009.
Richard Russell (Dow Theory Letters): Gold trade getting crowded
“An interesting article appeared in yesterday's Financial Times. The title of the piece was ‘I Don't Like the Big Shiny Crowds Around Gold' by John Dizard.
“Russell comment: This sudden wide spread interest in gold has bothered me too. Ads for gold are appearing in the newspapers, articles about gold are now commonplace. Writes Dizard, ‘I don't like crowds, and the one around gold is just too big at the present. Let's say that Western civilization is coming to a bloody end. That won't happen for a few months at least. So why not wait until you don't have to pay an unjustifiable premium for something as common as a Krugerrand.'
“‘Having said all this, I agree with the gold buyers that we are in a multi-year gold bull market that will eventually take the price to an integer multiple of where it is now, not a big integer multiple. But enough to approximate now much inflation must shrink the real burdens of debt to what the developed country taxpayer and consumer can afford.'
“‘Gold is one of, if not the most, treacherous trading markets there is. Ian Shapolsky, a New York investor, who trades for his own account, and whose tactical gold trading strategy I described in his space a couple of years ago, has abandoned the metal after a reasonably successful run.'
“As he says, ‘The gold market is thinner than it was, and it seems that the larger players can push it around more than they could in the past. The larger traders are aware of the chart points (price targets) followed by the investing public; and there seems to be a lot of effort to push prices above breakout points or moving averages.'
“So stay out of the deep end, average in. Don't buy in a panic.”
Source: Richard Russell, Dow Theory Letters , February 4, 2009.
Commodity Online: Gold accumulation plan from India Post
“Buoyed by the runaway success of its gold coins sale scheme across the post offices in the country, India Post, the postal services department of the government of India, has announced a Gold Accumulation Plan.
“India Post, in association with the World Gold Council and Reliance Money, a financial services company of the Reliance Group, on Wednesday said that the Gold Accumulation Plan (GAP) will be carried out through its wide postal networks across the country.
“As per GAP, customers can purchase gold coins from any India Post offices across nine states in the country. ‘The GAP project ensures that people have the options like the Systematic Investment Plans of investing in gold by accumulating small quantities of the yellow metal,' Sunita Trivedi, Chief General Manager, India Post told Commodity Online.
“‘This is to promote gold investment in India. Going forward, we not only plan to further expand this service to another 100 India Post outlets but also launch our Gold Accumulation Plan to help customers make systematic investments in gold,' she said.”
Source: Commodity Online , February 5, 2009.
Telegraph: China falls into budget deficit as spending balloons
“China's attempts to spend its way out of economic depression led to a fiscal deficit of 111 billion yuan (£12 billion) last year.
“Despite a near 20% rise in tax revenues and a record surplus of 1.19 trillion yuan (£128 billion) in the first six months of the year, the dramatic scale of government spending in November and December was enough to plunge the entire year into deficit.
“The figures are the first indication of how quickly and forcefully China reacted to the economic crisis after it announced a fiscal stimulus package of 4 trillion yuan in November to build new roads, railways, schools and hospitals.
“Government spending in December surged to 1.66 trillion yuan, more than triple the previous month's total and 31% higher compared to the same month last year.
“The news came as Wen Jiabao, the Chinese prime minister, said that he was mulling over another fiscal stimulus package. ‘We may take further new, timely and decisive measures. All these measures have to be taken pre-emptively, before an economic retreat,' he told the Financial Times.
“Although Mr Wen did not mention any concrete details, it is widely believed that the Chinese government wants to put together a social benefits package, in order to encourage people to up their spending and reduce their saving.”
Source: Malcolm Moore, Telegraph , February 2, 2009.
Financial Times: MDC agrees to join Mugabe government
“Zimbabwe's opposition has bowed to pressure and agreed to join a national unity government with President Robert Mugabe in a last-ditch effort to halt a humanitarian catastrophe.
“In spite of deep misgivings on the part of some party leaders and trade unionists, the Movement for Democratic Change (MDC) decided that it had no choice but to accept the terms of a deal negotiated by southern African leaders this week, even though its key demand - control of policing through the home affairs ministry - was not met.
“Morgan Tsvangirai, the MDC leader and winner of a first round of presidential elections last year, emerged from a party vote on the issue on Friday sounding sanguine. He will be sworn in as prime minister on February 11. MDC politicians will occupy 11 of the 31 cabinet posts, including finance, education and health.
“The scale of the humanitarian crisis that the new administration will face was underlined when the World Health Organisation warned that ‘the deadliest cholera outbreak in Africa for 15 years is gaining momentum, with 1,493 new cases including 69 deaths reported in the last 24 hours alone'. About 60,000 Zimbabweans have caught the illness and more than 3,000 have died.”
“‘We are not saying that this is a solution to the Zimbabwe crisis,' said Mr Tsvangirai. ‘Instead our participation signifies that we have chosen to continue the struggle for a democratic Zimbabwe in a new arena.'”
Source: Tony Hawkins and Richard Lapper, Financial Times , January 30, 2009.
Did you enjoy this post? If so, click here to subscribe to updates to Investment Postcards from Cape Town by e-mail.
By Dr Prieur du Plessis
Dr Prieur du Plessis is an investment professional with 25 years' experience in investment research and portfolio management.
More than 1200 of his articles on investment-related topics have been published in various regular newspaper, journal and Internet columns (including his blog, Investment Postcards from Cape Town : www.investmentpostcards.com ). He has also published a book, Financial Basics: Investment.
Prieur is chairman and principal shareholder of South African-based Plexus Asset Management , which he founded in 1995. The group conducts investment management, investment consulting, private equity and real estate activities in South Africa and other African countries.
Plexus is the South African partner of John Mauldin , Dallas-based author of the popular Thoughts from the Frontline newsletter, and also has an exclusive licensing agreement with California-based Research Affiliates for managing and distributing its enhanced Fundamental Index™ methodology in the Pan-African area.
Prieur is 53 years old and live with his wife, television producer and presenter Isabel Verwey, and two children in Cape Town , South Africa . His leisure activities include long-distance running, traveling, reading and motor-cycling.
Copyright © 2009 by Prieur du Plessis - All rights reserved.
Disclaimer: The above is a matter of opinion and is not intended as investment advice. Information and analysis above are derived from sources and utilizing methods believed reliable, but we cannot accept responsibility for any trading losses you may incur as a result of this analysis. Do your own due diligence.
Prieur du Plessis Archive |
© 2005-2022 http://www.MarketOracle.co.uk - The Market Oracle is a FREE Daily Financial Markets Analysis & Forecasting online publication.


