


Re-Scaling Global Stock Market Perception
Stock-Markets / Elliott Wave Theory Apr 30, 2007 - 12:06 AM GMTBy: Joseph_Russo

 BACKDROP
In April of 2006, we were quite aware of the parabolic price movements taking place amid numerous global equity markets. We weighed in on the matter with a piece entitled Global Contagion.
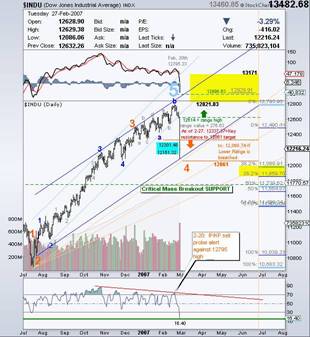
On September 14, 2006 with the Dow trading at the 11,500 level, Elliott Wave Technology forecast an imminent critical mass building within the Industrial Average. At the time, we shared those observations in our presenting Equity Markets Approach Critical Mass .
Throughout our chronicling the decisive capture of the sudden 6% decline in March through the power of chart analytics , we were fully anticipating fresh historic highs for the Dow Jones Industrial Average well north of 13K.
ECONOMIC COUP D'ÉTAT
After decades of monetary alchemy and overbearing influence, the aging global financial sphere continues to play out one of its most overt campaigns of economic coup d'état of the past 100-years. One may surmise that by design, lack of fiduciary oversight, or both, that the aging sphere has in effect, usurped all of the world's central banks along with their respective sovereign governments. In order to preserve itself, it now appears to have discreetly acquired a full-spectrum control of all things financial.
Financial Sphere's Slam-Dunk Victory catapults U.S Equities toward 7-year highs
The global financial sphere has indeed taken on a life of its own, perhaps subsuming that of the real economy itself. Held to account only by the ability to sustain itself, it has morphed into a most fragile, highly addictive paradigm, requiring ever-frequent fixes to avoid the slightest measure of interruption to which the mere hint, would engender the excruciating pangs of tumultuous withdrawal.
One could speculate that to maintain viability, the aging sphere is fighting for its very survival and has resorted to anointing itself both the driver and buyer of every resort. With unfettered grip on the economic baton, it appears quite capable of shaping perception relative to the strength and integrity of financial markets around the globe.
It is becoming abundantly clear that the United States is no longer the epicenter to this rather old and maturing dynamic center of global trade and influence. The USA remains a key player however, and at present, maintains monopoly on the worlds reserve fiat currency.
With the king fiat nearing multi year lows, many global equity markets have hyper-extended their already parabolic bullish advances. From their lows in March, the U.S markets have suddenly awakened with a renewed sense of exuberance toward equities.
 |
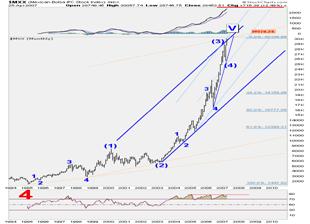 |
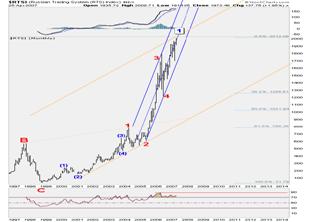
| Chart 2: The Russian Trading System | Chart 3: The Mexican Bolsa |
On balance, global equity indices remain extraordinarily bullish in nominal terms. At times of such extreme exuberance, it is critical for traders and investors to respect elevated risks as markets enter or extend near vertical price advances. Complacency and overconfidence that fresh new highs will follow each and every correction amounts to nothing more than a recipe for watching massive paper profits vanish.
Alternately, one does not want to be short equities, or in cash as markets continue rising amid a most spectacular bullish run, especially as one's fiat currency falls in value relative to the price of Gold. Those who have yet to engage the long side of equities face growing risk of doing so with each phenomenal new record high. Caution goes out to such individuals who may be salivating with envy of not having boarded the runaway party train sooner. The later one boards, the more assertive ones method of entry and subsequent defense must be in lieu of potential derailment.
Elliott Wave Technology has been monitoring this fantastic global equity boom diligently, and with great interest for some time now. In addition, we are closely monitoring the recent resurgence in U.S equities. Recognizing the financial markets current vigor, while remaining fully cognizant as to the effects that "real" monetary inflation can have on equities, we are compelled in the best interest of our readership, to begin monitoring a broad array of global indices.
We are monitoring global markets for long-term structural integrity. Our trusted brand of analysis will blanket the market action to reveal early fracture points, and danger zones warranting investor and trader attention. Moreover, we will be providing price targets for the intermediate and larger degrees of trend.
To address the "real" monetary inflation effects of a nation's fiat currency vs the value of Gold, when available, we shall plot the host country's currency vs the value of Gold, behind that of its major equity index. This visual anchor will be of tremendous value in assessing the masked inflation deeply embedded, and relied upon across the entire financial sphere.
Elliott Wave Technology has earmarked the following markets for such coverage:
Australia's ASX, China's Shanghai Stock Exchange, The Russian Trading System, India's Bombay Stock Exchange, Brazilian Bovespa, Mexican Bolsa, Tokyo Nikkei Average, London Financial Times Index, French CAC 40 Index, German DAX, Dow Jones Industrial Average, NASDAQ Composite Index, GOLD, SILVER, 20-Year US Treasury Yield, and the Dow Jones World Stock Index.
The next scheduled quarterly report for the above markets is for mid-June however; a partial chart preview of these markets is available right now . To add value, and best serve the readership at large, we will begin including these quarterly reports with our Interim Monthly Forecast . Given recent market developments, we thought it prudent to release early preview to this report prior to its scheduled release date.
The current dynamism of the global financial markets is extraordinary. With epic dynamism comes fantastic opportunity accompanied with equally associated risks. Considering the sheer mass of impending structural imbalances, along with the array of geopolitical challenges confronting the present financial sphere, it is with great honor and sincerity that we provide the most careful and measured guidance to protect and reassure individual traders & investors in the challenging, and rewarding years ahead.
Below, we have provided an example of our comprehensive long-term structural analysis for the Dow Jones World Stock Index. By the June publication date, we will have completed analysis on all of the charts from the above list in similar fashion.
From Elliott Wave Technology's Millennium Wave Quarterly Report (Preview)
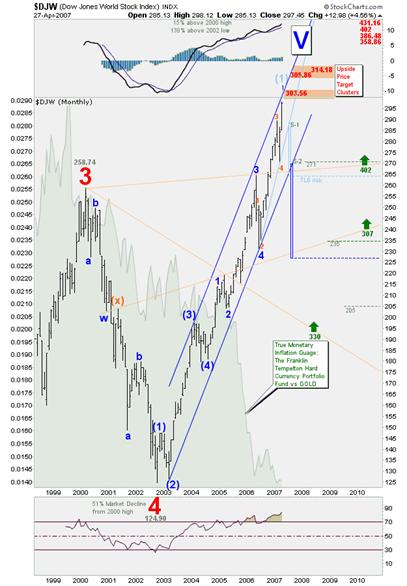
Chart 4: The Dow Jones World Index / Franklin Templeton Hard Currency Fund vs Gold (behind price bars)
 The Dow Jones World Stock Index:
We have included the Dow Jones World Index as a proxy benchmark for global equities. Charts will appear much larger, and with greater clarity from our secure website.
Four Long-term Chart & Analysis protocols featured in our MWQR reports:
-
The solid green descending mountain seen behind the monthly price bars of this index-is its "true" monetary inflation gauge. Its data derived from plotting the price of the Franklin Templeton Hard Currency Portfolio against the price of Gold. Since fiat currencies "float," (or more aptly sink) there is no better universal standard of measure to gauge the health of such currencies than to put them to task against the Gold Price. It is abundantly clear that this stock index has benefited tremendously in nominal terms as the real value of fiat currencies loosely associated with it have (inflated) tumbled considerably.
-
Though degrees of trend are subject to shift amid changing market dynamics, our current wave analysis observes the Dow Jones World Stock Index as rising in a 5th wave of Primary Degree. The narrowly channeled V-reversal-138% advance from the 2002 low, (now 15% above its primary 3rd wave crest) has been spectacular! The structure of this robust advance currently lends itself to that of an extending (5) wave at Intermediate degree. Note the alternate (1) label in light blue at the top of the chart. We provide such alternates in the event our interpretation of "degree" is not in confluence with the level of dynamism inherent in the price action.
-
The price charts go a number of years ahead of the current time. In this case, out to the 2010 period. We populate this space with a host of critically essential and user actionable information. The upside price targets listed here, are noted with green arrows along with trendlines in support of reaching each of the targets. The smaller dashed-horizontal gray lines, are listed price levels of anticipated corrective declines once the larger cycle reverses. Last are the narrow vertical tubes, which represent "weak spots," or points of potential fracture that may breach the structural integrity of the current trend. These "fracture tubes" have tentative horizontal price targets associated with them, which adjust dynamically contingent upon the point of fracture.
-
The red numbers listed in the upper part of the chart are fibonacci price target clusters for the current degree of trend, and its associated subdivisions now in progress.
Franklin Templeton Hard Currency Portfolio:
The Fund invests primarily in high quality, short-term money market instruments (and forward currency contracts) denominated in currencies of foreign countries and markets that historically have experienced low inflation rates.
We trust the value in having access to such a precise long-term navigational monitor is self-evident. Those yet to board such markets, or seeking to add exposure, may strategically and prudently do so with reduced risk, at identified levels of key longer term support. Alternately, those seeking to "take partial profits" may do so as markets strike overhead areas of resistance, or reach resting targeted milestones.
Most importantly, in light of the violent, fast, and parabolic nature in which many markets currently trade, it is vital that one be fully cognizant where key levels of structural integrity may breach, and potentially cause the entire house of cards to crumble.
Bear in mind, what has taken years to build, is typically destroyed in a matter of weeks or months. Moreover, as evidenced by the performance of the Japanese Nikkei index over the past twenty years, after scaling such incredible heights for extended periods, when such wreckage occurs, it often lasts for considerable lengths of time.
Our approach to long-term forecasting is by no means arcane. We do not "predict prices;" nor become reliant upon previously stated predictions coming true; instead, we adapt to the dynamic price action as it unfolds. Doing so impartially, allows us to formulate astute and measured guidance based on the dynamic evolution of price.
Trade Better / Invest Smarter...
By Joseph Russo
Chief Editor and Technical Analyst
Elliott Wave Technology
Copyright © 2007 Elliott Wave Technology. All Rights Reserved.
Joseph Russo, presently the Publisher and Chief Market analyst for Elliott Wave Technology, has been studying Elliott Wave Theory, and the Technical Analysis of Financial Markets since 1991 and currently maintains active member status in the "Market Technicians Association." Joe continues to expand his body of knowledge through the MTA's accredited CMT program.
© 2005-2022 http://www.MarketOracle.co.uk - The Market Oracle is a FREE Daily Financial Markets Analysis & Forecasting online publication.