


Smart Money Moving Out of Gold: Trading Gold, SIlver and Oil ETF's
Commodities / Gold & Silver 2009 Feb 25, 2009 - 05:02 AM GMTBy: Chris_Vermeulen

 The past few days have been stressful, as I watched gold slowly work its way higher without a decent correction to take another position. Both gold and silver have been on a tear moving higher not allowing the more conservative trader like my self with a low risk setup and entry point. I am not a fan of chasing prices higher, as it generally leads to a quick loss when prices snap back and correct from an over bought state. This is what both gold and silver did today and I expect to see lower prices over the next week or so, depending on how fast they correct. Last Friday I mentioned the open interest on gold went down sharply, which told me that smart money was moving out of gold and that is always a RED FLAG. Let's take a look at the charts below because that's what trading is all about Price Action.
HUI Gold Bugs Chart – Monthly Long Term Trading
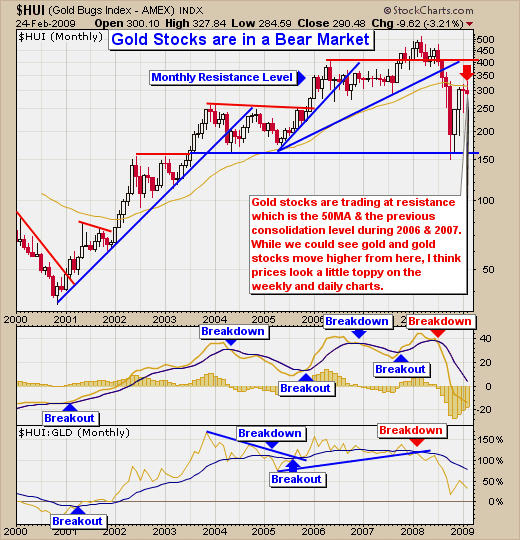
The monthly chart of the gold equities index shows a simple and clear picture.
- Bounced to the 50 period moving average (Resistance/Profit Taking Zone)
- 50% retrace from the top in 2008 to the low in 2008 (Resistance Level)
- Bounce and found resistance at the 2006 -2007 consolidation level
- Chairman Bernanke mentioned inflation should not be an issue – Bearish for Gold
Gold Equities from an Active Traders Point of View – HUI Daily Chart
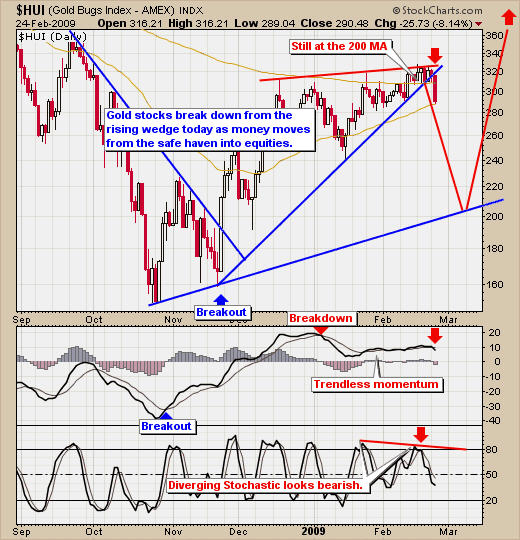
Gold stocks had a very clean break down today from an ascending bull wedge. This is a great trade for highly speculative traders who want to catch quick short trades. Today's big move warrants an update tomorrow for gold stocks, which could provide a better entry point before prices continue to come in (decline in price). The reason I say this is highly speculative trade is because gold and gold stocks have been very strong and prices may just continue sideways as they coil up for another move higher. Always have protective stops in place.
- Break down from wedge (Bearish)
- Found resistance the 200 moving average (Resistance)
- MACD made a clean move lower today (Bearish)
- Stochastic indicator has diverging tops from HUI price action (Bearish)
Active Traders View on Trading the GLD Gold Fund – Daily Chart
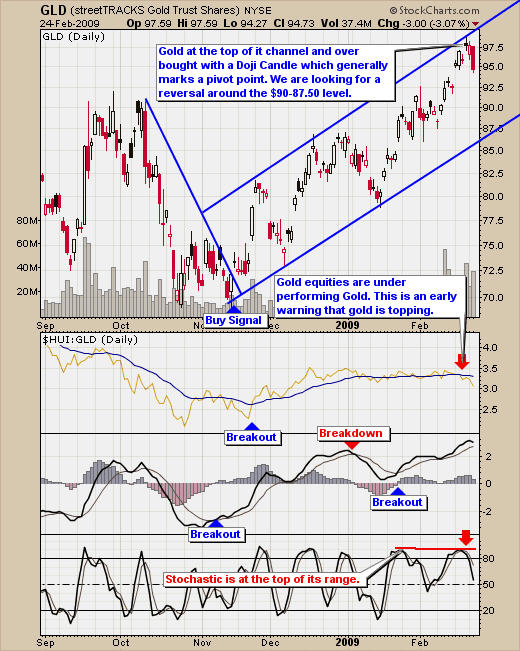
Gold has been over bought since it reached $90 several weeks ago, at which point I was expecting a pullback to provide an entry point but then more bad news hit the wire sending another surge of gold buyers into the market pushing it higher with out correcting.
- Gold is at the top of it trading channel (Bearish)
- Gold stocks are clearly under performing gold (Bearish)
- MACD is starting to roll over
- Stochastic indicator has hooked and started down sharply (Bearish)
- I would expect to see a bounce/reversal when gold reaches the $90 level
SLV Silver Weekly Chart – Trading Chart
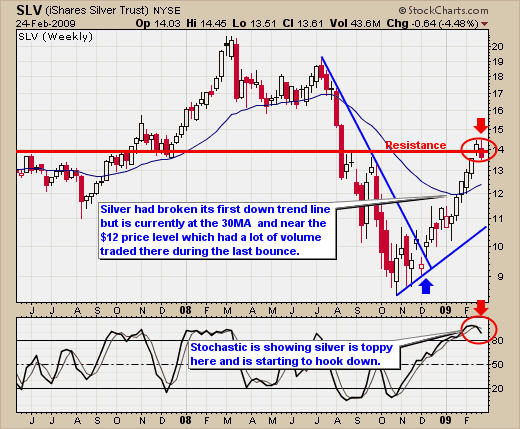
The weekly chart shows as speculative trade, for shorting silver, which could correct back to the $11.50 - $12 range in the next couple weeks.
- Silver at long term resistance (Bearish)
- Stochastic indicator Hooked down (Bearish)
- Next support level $12.00 Range
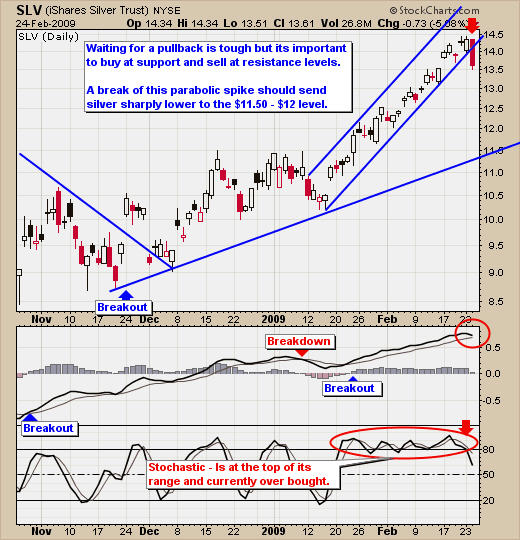
SLV Silver's Active Trader Point of View – Daily Chart
Silver has really performed well this year forming a mini parabolic spike, which generally leads to a sharp bank breaking correction, which silver is known for.
- Silver broke down from rising parabolic channel (Bearish)
- MACD looks like its about to cross and give a sell signal (Bearish)
- Stochastic indicator moved down sharply today (Bearish)
- Support or silver should be found in the $12 level
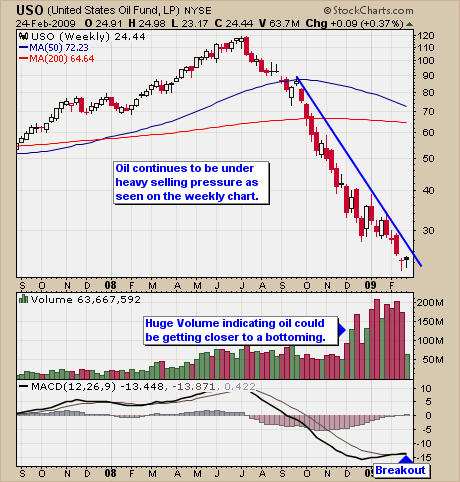
Crude Oil Long Term Trading Chart – Weekly USO Chart
Oil continues to be contained within the down trend line. With the poor economic outlook, demand for oil will be much lower thus the downward pressure continues.
- Oil stuck under down trend line (Bearish)
- Big volume indicating a bottom could be getting closer
- MACD crossed over today giving oil a buy signal but a trend line cross is needed
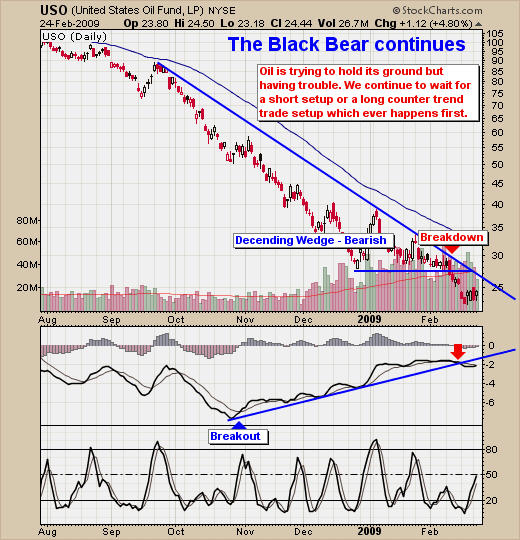
Crude Oil Active Traders Point of View – Daily USO Chart
Daily crude oil trading fund could go either way here and if we are lucky it will generate a buy or sell signal soon. Waiting is painful but there must be clean entry and exit points with a trend before putting hard money to work.
- Oil contained below the down trend line (Bearish)
- MACD broke down (Bearish)
- We continue to watch and wait for a trade
Gold, Silver & Oil Trading Conclusion:
Gold and silver are looking toppy and ready for a correction. The charts above show where things should be headed over the next few weeks. I am bullish on gold long term but I don't think it's going to be as good as many are expecting. I have been watching the price action closely and if we do get a bottom soon in the markets, I think we are going to see money coming out of gold and silver and into the broad market, where there are huge opportunities floating around. Oil I think will have some great opportunities soon. I think it is starting to get exhausted, as most oil traders have lost their shirts and are tired of trying to pick a bottom. With any luck, we will see oil turn up in March. We continue to wait for low risk setups and enter when the water is clear.
Hello, I'm Chris Vermeulen founder of TheGoldAndOilGuy and NOW is YOUR Opportunity to start trading GOLD, SILVER & OIL for BIG PROFITS. Let me help you get started.
I have put together a Recession Special package for yearly subscribers which is if you join for a year ($299) I will send you $150 FREE in gas, merchandise or grocery vouchers FREE which work with all gas stations, all grocery stores and over 100 different retail outlets in USA & Canada.
If you interested please act fast as I only have 67 of these vouchers before they are gone for good.
If you would like to receive my free weekly market updates please visit my website: www.TheGoldAndOilGuy.com
I look forward to hearing from you soon!
By Chris Vermeulen
Chris@TheGoldAndOilGuy.com
Please visit my website for more information. http://www.TheGoldAndOilGuy.com
Chris Vermeulen is Founder of the popular trading site TheGoldAndOilGuy.com. There he shares his highly successful, low-risk trading method. For 6 years Chris has been a leader in teaching others to skillfully trade in gold, oil, and silver in both bull and bear markets. Subscribers to his service depend on Chris' uniquely consistent investment opportunities that carry exceptionally low risk and high return.
This article is intended solely for information purposes. The opinions are those of the author only. Please conduct further research and consult your financial advisor before making any investment/trading decision. No responsibility can be accepted for losses that may result as a consequence of trading on the basis of this analysis.
Chris Vermeulen Archive |
© 2005-2022 http://www.MarketOracle.co.uk - The Market Oracle is a FREE Daily Financial Markets Analysis & Forecasting online publication.