Commodities Market Wrap - Gold, Silver, Crude Oil and Mining Stocks
Commodities / Gold & Silver Stocks May 07, 2007 - 04:37 PM GMTBy: Douglas_V_Gnazzo
Gold gained $7.90 (1.16%) for the week, closing at $689.70. It was gold's highest close in 8 weeks. Its intraday high for the week was $693.20, and its intraday low was $670.00.
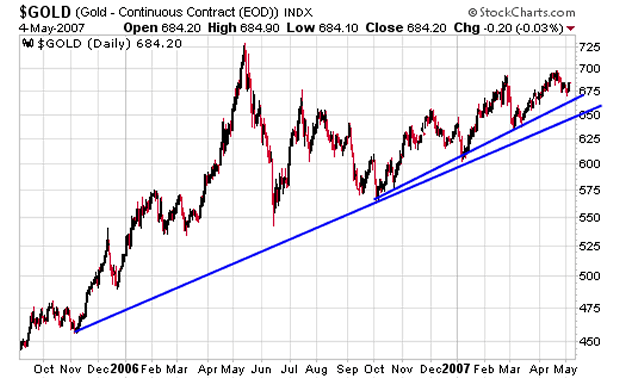
Below is gold's daily chart, which shows two support lines - the first is closest to the present price, and the second is further below.
Over the short term we are of the opinion that the first support line holding is the most probable scenario. If it holds then a test of the highs would be in order.
If the first support holds and a test of the high then follows, we do not think that the highs will be bettered by a significant amount for a sustainable time period. The most likely scenario would be for a retest of the lows before the next full fledged bull phase gets under way.
The second option is that the first support line does not hold for gold and gold corrects down to its second support line. If this occurs then it increases the likelihood that a test of the highs will be forthcoming, and the odds increase that it will be surpassed with a sustainable move for a few months before the next serious correction occurs.
These are just two of the many possible scenarios, however, it is the two we consider most probable. No guarantees - just probability.
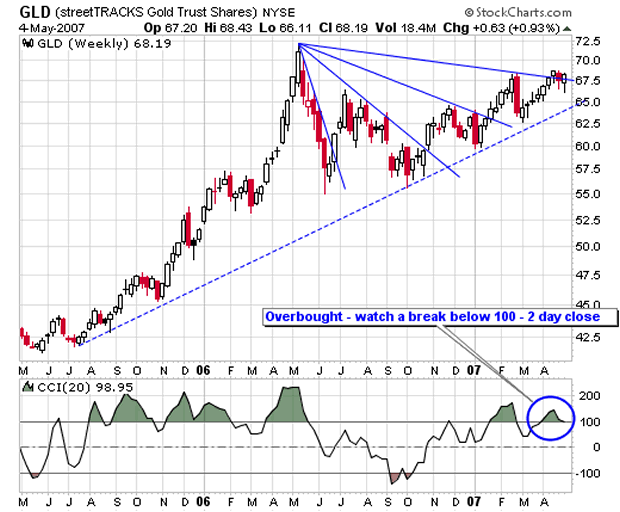
After gold's daily chart is a weekly chart of GLD. Notice the CCI indicator at the bottom of the chart. If the 100 level is breached to the downside - the 2nd above scenario is most likely.
Silver
Silver was down -0.05 cents (-0.52%) to close at $13.53. Silver had a higher close on Monday of this past week, closing at $13.57. The metal has not been performing as well as gold as of late.
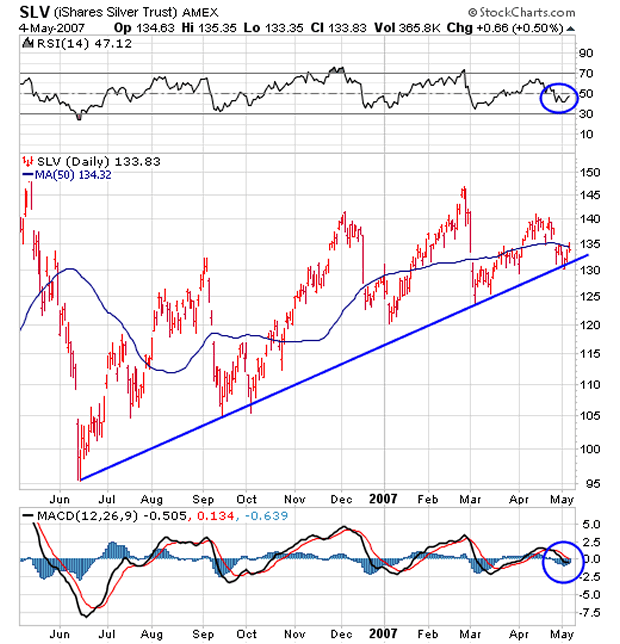
First up below is the daily chart of SLV (silver etf) that shows its bottom trend line recently held up and the price has bounced off and back up. It is just bumping up into and testing its 50 day moving average.
MACD appears to be getting ready to put in a positive upwards cross over - but that remains to be seen. RSI has turned up and may be headed back up to the 70.s. Several of the silver miners are performing quite well: SSRI, PAAS, SIL, and SLW, which tends to indicate that investors are looking ahead to higher silver prices.
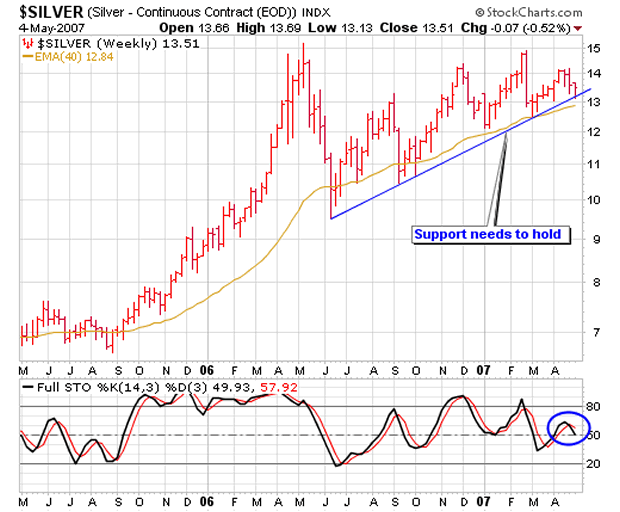
The second chart is the weekly prices for silver. It is testing its bottom support line, and the MACD indicator has had a recent negative cross over to the downside.
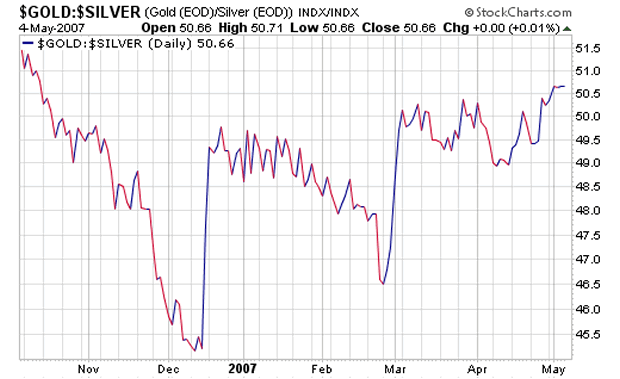
The third chart show gold compared to silver. Silver had been out performing gold but the tide has changed. Gold is now stronger.
Precious Metal Stocks
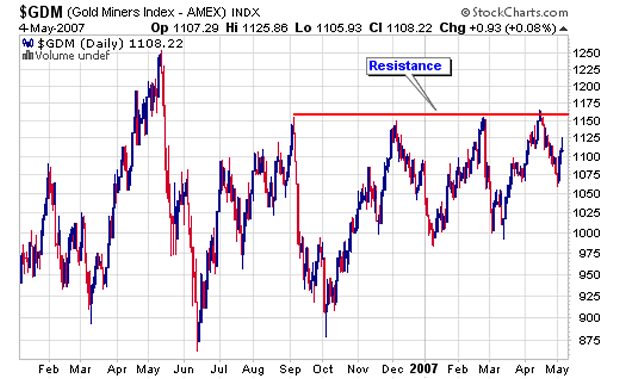
Next is the daily chart of the GDM (gold miners index). Horizontal support is indicated. The index is rallying up towards resistance. The index closed well above last weeks low of 1059, which suggests further upside action is coming.
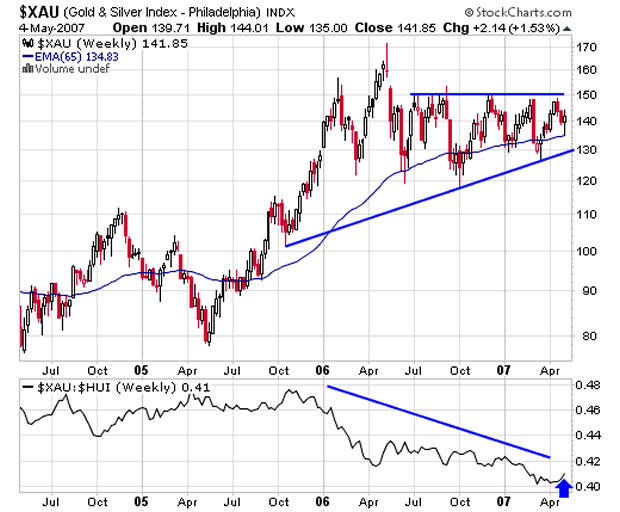
Next up is the weekly chart of the xau index. The chart clearly indicates both resistance and support.
Presently, the price is right in the middle of the top support line (150) and the bottom support line at 130.
Also, note at the bottom of the chart the comparison between the xau and the hui. The chart indicates that the hui is performing the stronger of the two.
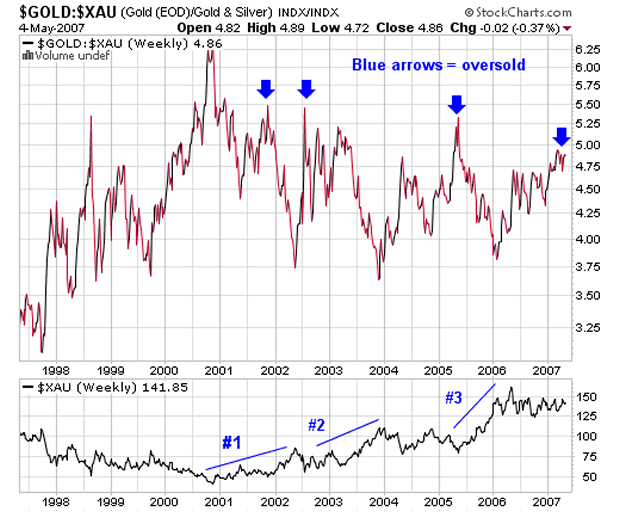
Below we have the chart comparison between gold and the xau. The chart shows the times when the xau was oversold compared to gold. In the past such times offered a very good buying opportunity.
Right now, notice that the ratio has crossed above the beginning of oversold resistance at five (5).
Also, the xau has been going sideways for about a year now, yet the ratio is suggesting that the xau is oversold in comparison to gold; and that this may be a good buying time frame (a bottom).
Hui Index
The Hui closed the week out on a positive note - up 1.08 pts to 345.91. It was the highest daily close for the week.
The index hit an intra-day high of 351.85 on Friday before backing off into the close, and it made an intra-day low of 333.70.
This is significant price action, as 333 represented last week's low and a break of that low would have indicated there was still more downside action to come.
The positive weekly close suggests higher prices should be coming within the next few weeks, and quite possibly before the end of this coming week .
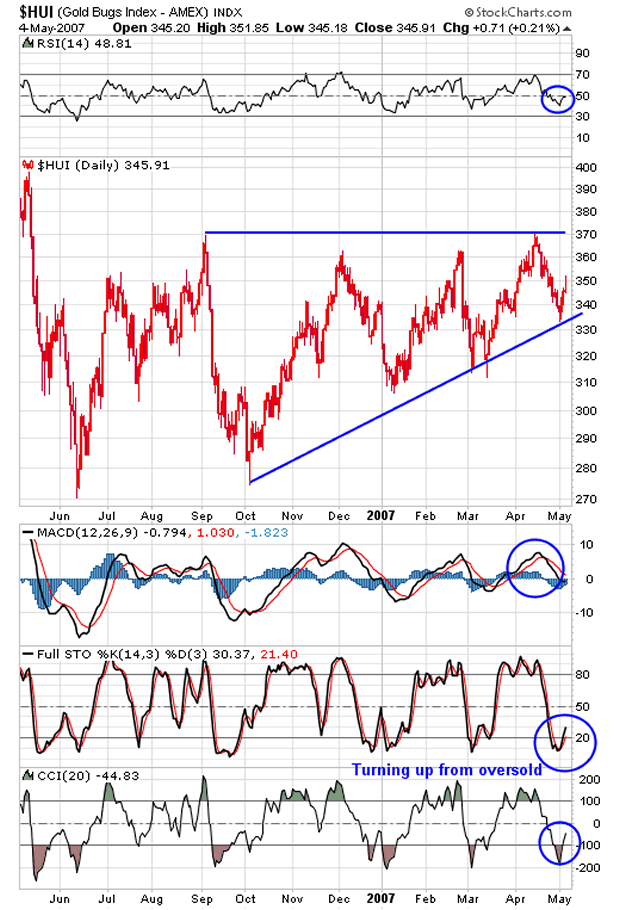
First is the daily chart of the Hui. It shows a mixed bag with some positive indicators or markers and some negative as well.
The index is clearly above its bottom trend line - a positive attribute. Last week's low price was not broken and for the week the index closed positive - both constructive events.
Relative strength is turning up, which is another good sign, and both the stochastic and the CCI indicator are turning up from oversold condition.
The MACD indicator is still in a negative cross over position. This needs to be resolved to the upside if any kind of sustainable rally is to occur.
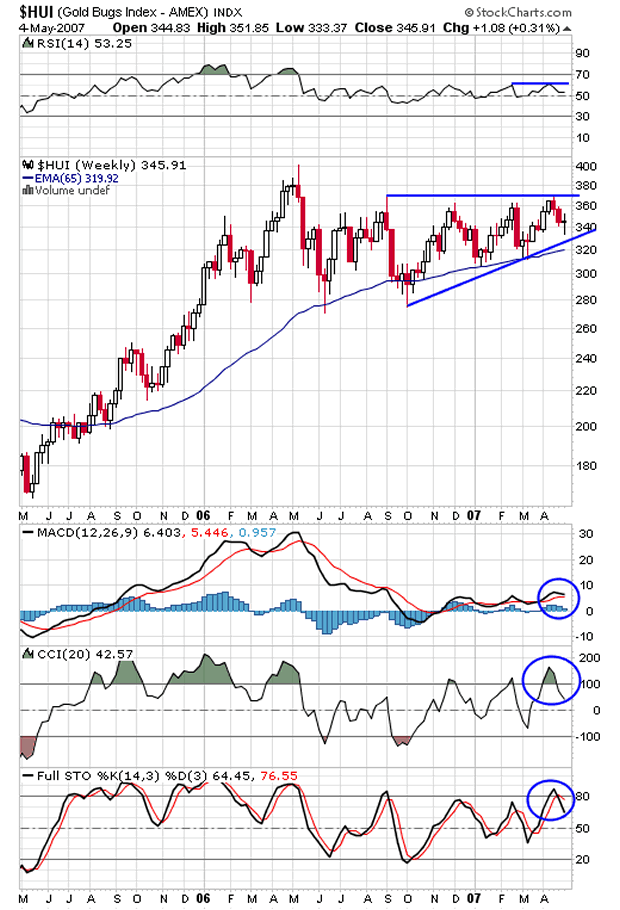
Next is the weekly chart of the Hui. It has more negative indicators then positive ones.
RSI is still showing a negative divergence. Both the stochastic and the CCI indicator have turned over and down from overbought territory.
MACD remains positive, however, it wouldn't take much downside price action to turn the MACD down with a negative cross over. The histograms are also receding back towards zero.
The present price is just about in the middle of its trading zone, and well above its bottom trend line by about 15 points.
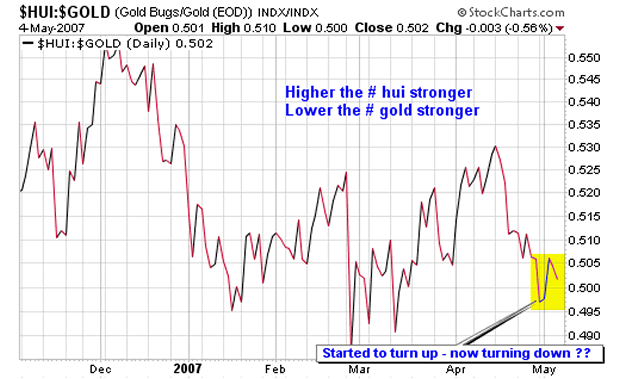
Below are two different charts showing the Hui/Gold ratio comparison. The first chart shows the daily numbers for the last half year. The Hui had been performing better than gold but has again turned down. This needs to be turned up in positive territory and trend.
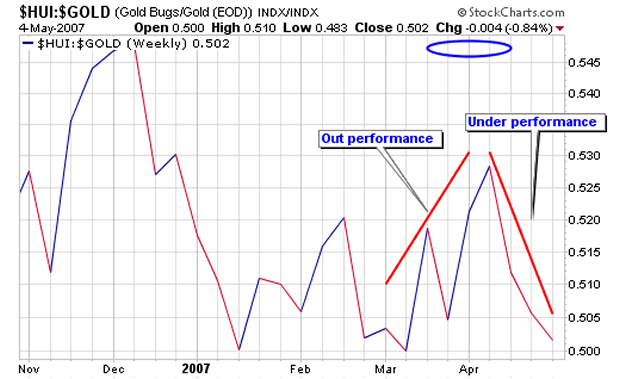
The weekly chart of the ratio below indicates that the ratio is in a pronounced but oversold area.
We think it worth mentioning that the Hui Index is a weighted index and that just a few stocks represent 40% of the Hui value (price). Below is the break down of the Hui.
As can be seen - Newmont (NEM) and Gold Corp. (GG) each represent 15% of the index with FCX another 10%. Hence 3 stocks account for 40% of the total weighting.
Both Newmont and Gold Corp. have been in significant corrections due to company specific issues. Thus their performance has been skewing the overall performance of the Hui to the downside. The remaining 12 stocks constitute 60% of the index (5% per).
HUI : AMEX Gold BUGS (basket of unhedged gold stocks). A modified equal dollar weighted average that is designed to be roughly capitalization weighted. As of 3/19/07, it is composed of fifteen issues. NEM (15%), GG (15%), FCX (10%), AEM, AUY, CDE, EGO, GFI, GOLD, GSS, HL, HMY, IAG, KGC & MDG (5% each).
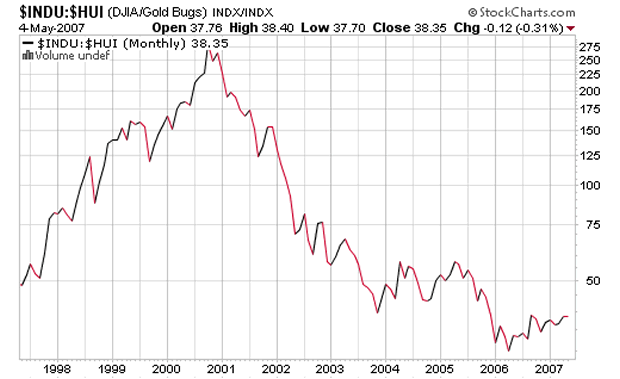
I have been receiving a fair amount of emails questioning why the hui is down while gold is up, and while the overall stock market is up making all time new highs.
In 2000 - the Dow was around 11,500 - today the Dow is at 13,264.00 (13,264-11500=1764) (1764/11500=15%).
I'll easily give the Dow the low of 7500 (13,264-7500=5764) (5764/7500=77%).
In 2000 the Hui was at 35, while today it is at 350 (350-35=315) (315/35=900%).
During the same time frame gold has increased by approximately 200%.
So, while the Dow gained 77%, and physical gold 200%, the Hui gained 900%. The winner - the gold stocks - by a mile.

Individual Gold Stocks
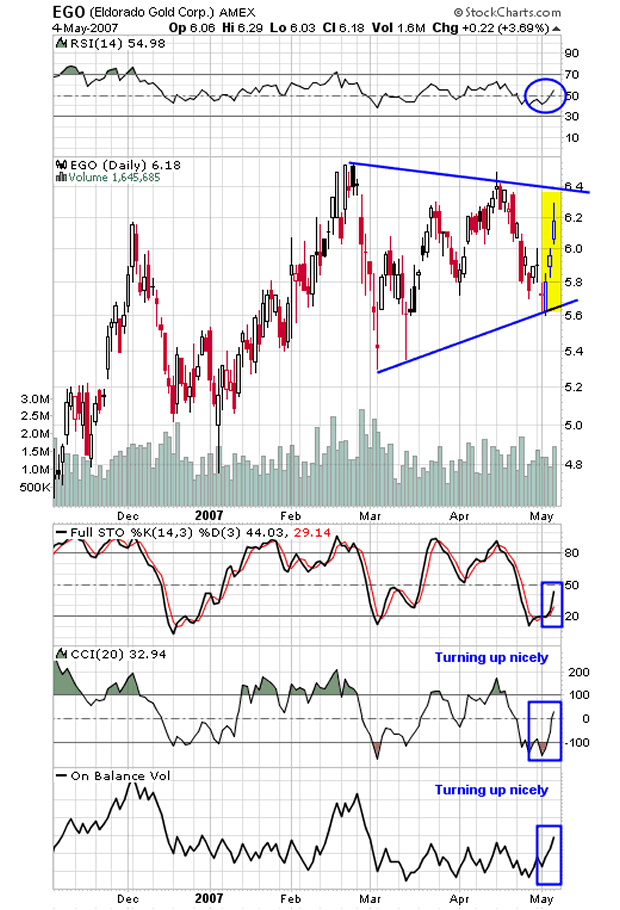
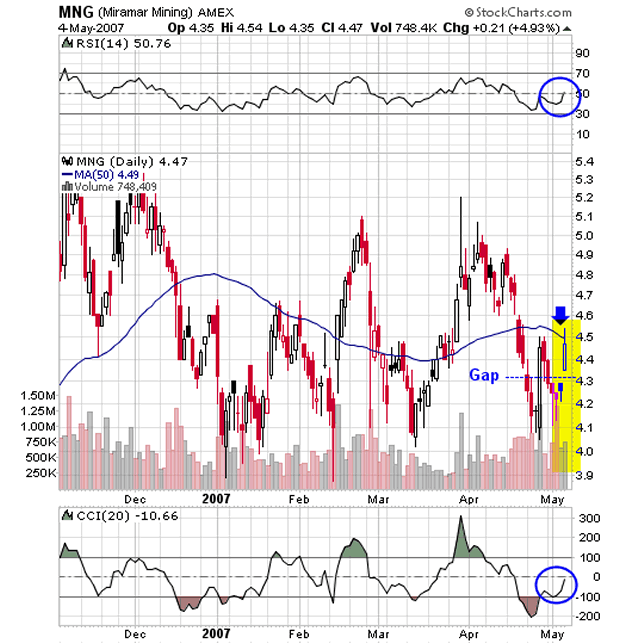
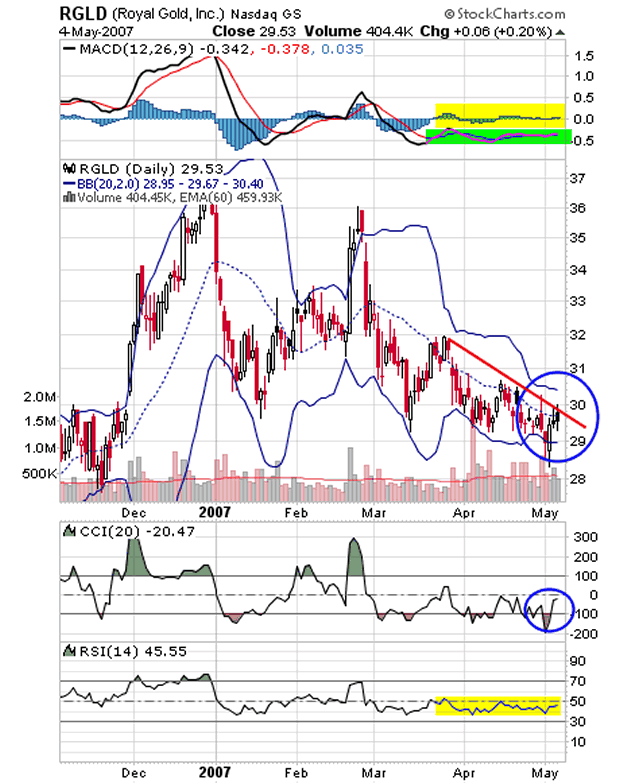
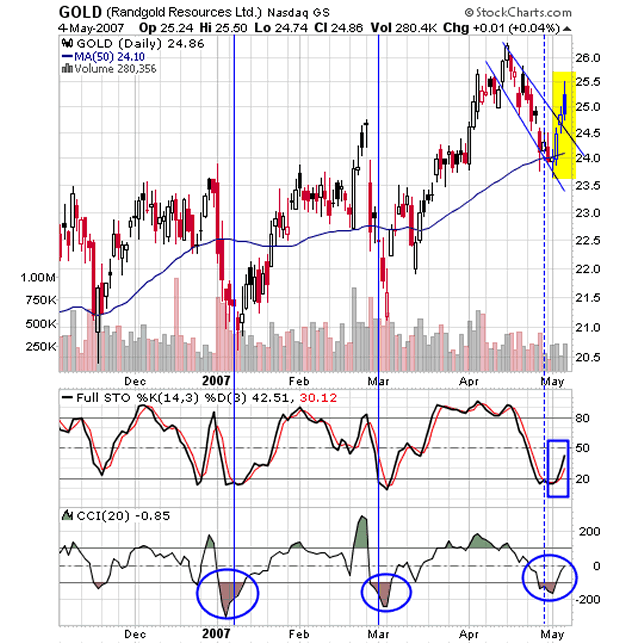
Up next are the charts of four gold mining stocks. The first two we already own: EGO and MNG. We may add more on weakness that holds support, or we may sell into significant strength.
The second two: Royal Gold (RGLD) and Randgold Resources (GOLD) we are watching and considering.
The charts are self-explanatory so no further comment is needed.

Summary
As we stated in the precious metals segment - there are the two most likely scenarios for gold. One would be for it to immediately test its old high, or to test its lows. We favor the first.
Further to the above, if the pog rises there are also two subsequent scenarios most likely to occur. Gold tests its high and then backs off, or gold tests its high and keeps on trucking. We favor the first.
Regarding the gold stocks we have two most probable scenarios as well. The gold stocks after a bit more consolidation continue up and test the old highs, or they go down from here to test their lows. We favor the first as most likely.
Just as with gold there are two subsequent scenarios for the gold stocks if they test their old highs in the near term. They will test the high and then fall back, or they will test the highs and break through and continue on into the next phase of the gold bull market. We are inclined towards the first.
Some of the possible contributing factors to this view are:
- The gold to gold stocks ratio is in overbought territory
- Many individual gold stocks are showing oversold levels
- Daily charts more bullish than weekly charts
- Daily charts show oversold levels
- Weekly charts show overbought levels
- May should record either a bottom or a top
- Based on the weight of the evidence last week - it's most likely a top
Invitation
Stop by our website and check out the complete +30 page market wrap, which covers most of the major markets, including stocks, bonds, currencies, commodities, and the precious metals.
There is also a lot of information on gold and silver, not only from an investment point of view, but also from its position as being the mandated monetary system of our Constitution - Silver and Gold Coins as in Honest Weights and Measures.
There is also a live bulletin board where you can discuss the markets with people from around the world and many other resources too numerous to list. Drop by and check it out. Good luck. Good trading. Good health. And that's a wrap.
Douglas V. Gnazzo
Honest Money Gold & Silver Report
Douglas V. Gnazzo is the retired CEO of New England Renovation LLC, a historical restoration contractor that specialized in the restoration of older buildings and vintage historic landmarks. Mr. Gnazzo writes for numerous websites, and his work appears both here and abroad. Just recently, he was honored by being chosen as a Foundation Scholar for the Foundation of Monetary Education (FAME).
Disclaimer: The contents of this article represent the opinions of Douglas V. Gnazzo. Nothing contained herein is intended as investment advice or recommendations for specific investment decisions, and you should not rely on it as such. Douglas V. Gnazzo is not a registered investment advisor. Information and analysis above are derived from sources and using methods believed to be reliable, but Douglas. V. Gnazzo cannot accept responsibility for any trading losses you may incur as a result of your reliance on this analysis and will not be held liable for the consequence of reliance upon any opinion or statement contained herein or any omission. Individuals should consult with their broker and personal financial advisors before engaging in any trading activities. Do your own due diligence regarding personal investment decisions. This article may contain information that is confidential and/or protected by law. The purpose of this article is intended to be used as an educational discussion of the issues involved. Douglas V. Gnazzo is not a lawyer or a legal scholar. Information and analysis derived from the quoted sources are believed to be reliable and are offered in good faith. Only a highly trained and certified and registered legal professional should be regarded as an authority on the issues involved; and all those seeking such an authoritative opinion should do their own due diligence and seek out the advice of a legal professional. Lastly, Douglas V. Gnazzo believes that The United States of America is the greatest country on Earth, but that it can yet become greater. This article is written to help facilitate that greater becoming. God Bless America.
© 2005-2022 http://www.MarketOracle.co.uk - The Market Oracle is a FREE Daily Financial Markets Analysis & Forecasting online publication.


