


Weekly Gold and Silver Technical Analysis Report - 13th May 2007 - Technically Precious with Merv
Commodities / Gold & Silver May 13, 2007 - 02:47 PM GMTBy: Merv_Burak

It looked like gold just fell off the cliff on Thursday. On the two previous occasions that gold took such a fall we had a good several week rally within a day or two after. Are we getting one again?
GOLD : LONG TERM
Still no movement in the long term P&F chart despite the plunge on Thursday. So we wait another week before reviewing the chart.
As for the usual long term indicators, the action is still comfortably above its long term moving average line with the line continuing to point upward. Momentum is still far enough away from its neutral line that it would take at least a few weeks of negative action to get it below the line. As for the volume indicator, it just crossed below its long term trigger line on Thursday but has probably bounced back above the line on Friday, although I do not have the Friday data yet. The trigger line is still pointing upward so volume has not collapsed yet.
On the long term we have not yet reversed our BULLISH rating but are getting more and more concerned that such rating is destined for a reversal soon.
INTERMEDIATE TERM
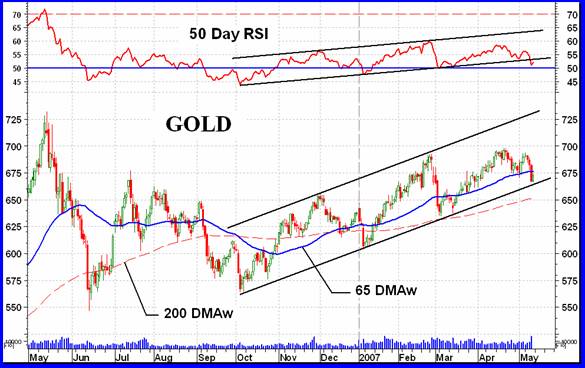
Despite the Thursday plunge the intermediate term P&F chart has not given us any new idea of reversal in progress. At the present time the price would have to drop to $655 before we get a reversal signal with both a trend line cross and two previous lows exceeded. That is not expected to be an immediate potential.
The chart this week has some interesting features. The plunge took us right to the up trend support line of the long/intermediate term channel and Friday was a bounce. We now need to see if we will get a rally as we have had in the past. Unfortunately, the momentum indicator is giving us a warning which we did not have in the previous occurrence of support bounce. The latest down turn in the price, although from a new recovery high, was not from anywhere near the upper resistance line as before. In addition, the momentum indicator gave us a negative divergence topping out lower that the previous high. It has now crossed its lower support and is on the verge of going fully negative. The moving average line has also oh so gently turned to the down side. All this suggests that this time there may not be the rally we have had before. I would be inclined to look for some sort of support next at the $635 level.
For now I have turned somewhat negative on the intermediate term trend but not yet fully bearish, so it's NEUTRAL for this week.
SHORT TERM
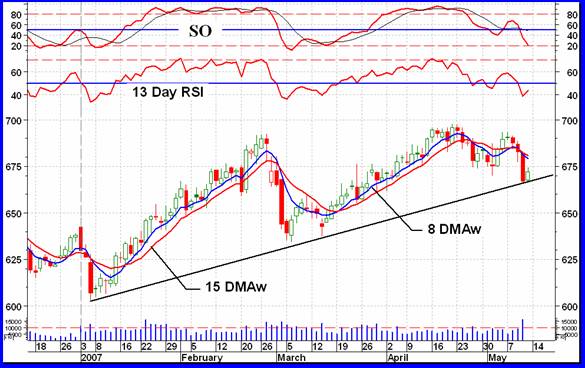
Two technical dynamics are at work on the short term potential. First is the up trend line which halted the Thursday plunge and from which we have had some good rallies in the past. The other dynamic is the lousy shape of the various short term technical indicators. Price below a negative moving average line (15 DMAw), momentum (13 Day RSI) in the deep doo-doo, below its neutral level and finally a lower low preceded by a lower high. Uptrend support line or lousy indicators, which is one to believe? I think at this point I will go with the indicators BUT understanding that we have had rallies immediately after a serious plunge and we just might be into one now.
IMMEDIATE TERM
Despite the rebound on Friday the immediate term trend looks to continue in a downward direction. The Stochastic Oscillator, although well into the negative zone, has not entered into the oversold zone and has a little more room to move lower. The volume during the Thursday plunge was too high to be taken lightly. Lots of selling going on and it may not be over yet. So, Monday and Tuesday, look for weak price action in gold.
NORTH AMERICAN GOLD INDICES
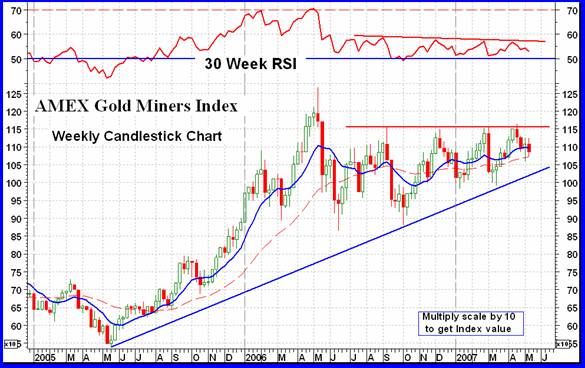
Four weeks ago we last looked in on the AMEX Gold Miners Index, an Index of about 40 North American Gold Mining stocks. From the looks of the chart nothing has changed in these past four weeks. We are still in a lateral drift extending back for almost a year. Sooner or later we will get out of this drift but the question is, on which side? I'm expecting it to break on the down side and in not too distant future, but who knows? Patterns with a flat top and upward sloping bottom are very often bullish patterns with upside breaks, so I am going against the grain. One good thing about technical analysis is that breaks, up or down, are quickly known and action can then be taken in the proper direction with not much loss of capital or opportunity.
All of the major North American Gold Indices are showing a very similar lateral chart pattern as that of the AMEX Gold Miners Index. The possible exception would be the S&P/TSX Global Gold Index but only in its slightly weaker Index action of late.
MERV'S PRECIOUS METALS INDICES
Readers to these commentaries may remember the Merv's Composite Index of Precious Metals Indices that was shown here a few weeks back. It showed a double top potential with the Index at the second top and just reacting lower. Well, it has continued lower making it more and more probable that it was in fact a double top. Of course we wouldn't know it for certain until the Index drops below its previous major low in between the tops, and that is still some distance away.
Subscribers to the Merv's Precious Metals Central service get a copy of each of the Merv's Indices for their information and to follow the trends of the various gold and silver sectors. Space limitations do not permit me to show them all here but I do include one of the Indices from time to time. The overall Merv's Gold & Silver 160 Index is the best one to understand the AVERAGE performance of the gold and silver stocks. It is once more shown below.
You will note the similarity in the Index versus the AMEX Gold Miners Index during 2005 and most of 2006. There then comes a great disparity between the AVERAGE performance of the 160 Index versus the performance of the AMEX Index, especially since late 2006. The only explanation that comes to mind is that the major Indices, as represented by the AMEX Index, are heavily weighted towards the performance of a few of their largest component stocks with the smaller stocks having next to no impact on the Index calculation while in the 160 Index ALL stocks have an equal weight. In an Index with 160 component stocks, the poor performance of several large stocks makes very little impact on the overall Index calculation. As the Precious Metals Indices Table suggest, the action over the past several months has been in the more aggressive speculative variety of gold stocks, of which there are quite a number in the 160 Index, enough to make an impact. This is the sector one would have been concentrating on if speculating in gold and silver stocks.
MERV'S GOLD & SILVER 160 INDEX
See chart above.
Except for the Spec-Silver Index all of Merv's Indices declined on the week with the overall universe of 160 stocks at the minimal end of the decline range. With a decline of 0.7% this past week it had a decline one third that of the major Indices. Although the advance since the October low seems to have stalled, once again, there is nothing yet in the indicators to panic that the world has come to an end, gold stock wise. The trend and all indicators are still positive for both the intermediate and long term.
Looking at the “breadth” of the gold stocks, we had a 2 to 1 ration of declining to advancing stocks during the week (31% advance, 66% decline). As for the overall summation of individual stock ratings, they moved further towards the negative with both the short and intermediate term rated as BEARISH (61% short and 56% intermediate) while the long term remained at a reduced BULLISH 55%. Lastly, in my plus/minus over 30% weekly performance category there were three stocks in this group this past week showing a slight increase in speculation. All three were on the plus side so that the speculation is still on the buy side and not on the dumping side.
MERV'S QUAL-GOLD INDEX : MERV'S SPEC-GOLD INDEX : MERV'S GAMB-GOLD INDEX
During the week the “quality” stocks were the hardest hit while the gambling variety were the least hit, with the speculative (mid-tier) stocks in the middle. The Qual declined 2.8% on the week, the Spec declined 1.0% and the Gamb declined 0.5%. The declining stocks pretty well tracked the same ratio with 90% of the Qual Index stocks declining on the week, 70% of the Spec Index stocks declining and 57% declines for the Gamb-Gold Index.
Looking over the indicators for the three sectors we find that the Qual-Gold Index is in a real slump. The Table gives us a Qual-Gold NEG rating for all three time periods but I would be inclined to hold off for at least another week as far as the long term rating was concerned. As for the other two sectors, the charts show positive indicators for intermediate and long term although the Table does have the Gamb-Gold rating as +N for the intermediate term. As for the summation of individual ratings, the Qual is in the BEARISH camp for all time periods while the Spec and Gamb Indices are in the BEAR camp intermediate term and still in the BULLISH camp for the long term.
MERV'S QUAL-SILVER INDEX : MERV'S SPEC-SILVER INDEX
The Qual-Silver Index was one of the poorer performers during the week with a 2.2% loss while the Spec-Silver Index was the best performer with a gain of 0.4%. The indicators are showing the weaker Qual versus Spec performance with the intermediate term for the Qual already in the Bear camp with a NEG rating. The long term Qual rating is still POS as are the two ratings for the Spec-Silver Index. However, both Indices are having problems moving higher.
MERV'S PRECIOUS METALS INDICES TABLE
That will be it for another week.
By Merv Burak, CMT
Hudson Aero/Systems Inc.
Technical Information Group
for Merv's Precious Metals Central
Web: www.themarkettraders.com
e-mail: merv@themarkettraders.com
During the day Merv practices his engineering profession as a Consulting Aerospace Engineer. Once the sun goes down and night descends upon the earth Merv dons his other hat as a Chartered Market Technician ( CMT ) and tries to decipher what's going on in the securities markets. As an underground surveyor in the gold mines of Canada 's Northwest Territories in his youth, Merv has a soft spot for the gold industry and has developed several Gold Indices reflecting different aspects of the industry. As a basically lazy individual Merv's driving focus is to KEEP IT SIMPLE .
To find out more about Merv's various Gold Indices and component stocks, please visit www.themarkettraders.com and click on Merv's Precious Metals Central . There you will find samples of the Indices and their component stocks plus other publications of interest to gold investors. While at the themarkettraders.com web site please take the time to check out the Energy Central site and the various Merv's Energy Tables for the most comprehensive survey of energy stocks on the internet. Before you invest, Always check your market timing with a Qualified Professional Market Technician
© 2005-2022 http://www.MarketOracle.co.uk - The Market Oracle is a FREE Daily Financial Markets Analysis & Forecasting online publication.