Gold Continues to Trend Lower
Commodities / Gold & Silver 2009 Apr 06, 2009 - 10:41 AM GMTBy: Mike_Paulenoff

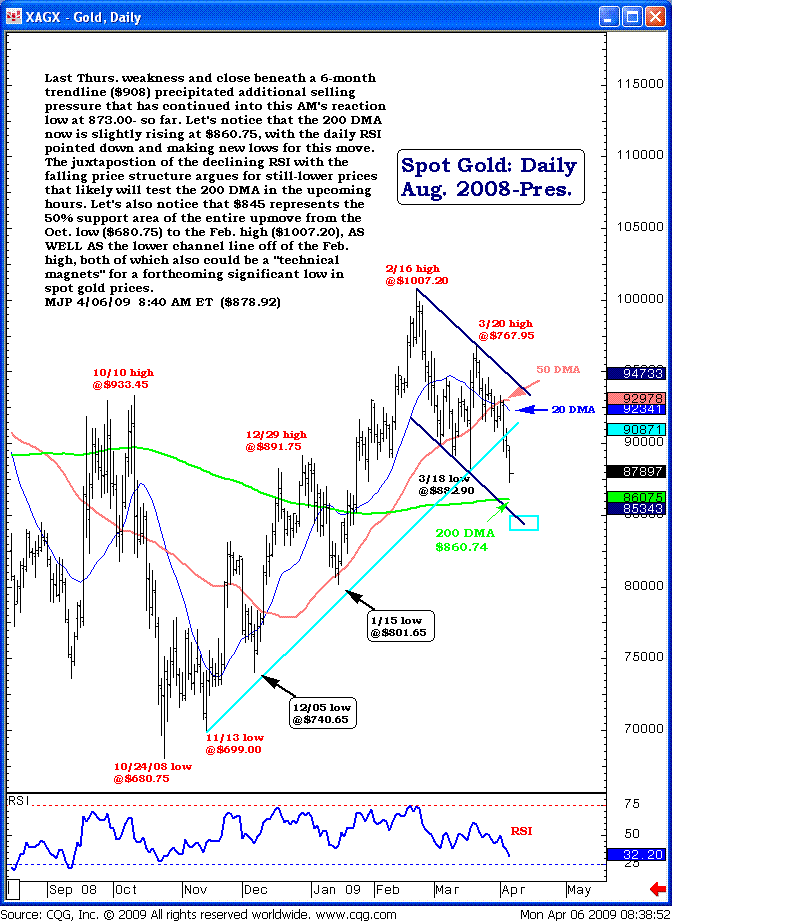
 Spot gold prices continue lower this morning. Last Thursday's weakness and close beneath a 6-month trendline ($908) precipitated additional selling pressure that has continued into this morning's reaction low at 873.00 – so far. Let's notice that the 200-day moving average now is slightly rising at $860.75, with the daily RSI pointed down and making new lows for this move. The juxtaposition of the declining RSI with the falling price structure argues for still-lower prices that likely will test the 200 DMA in the upcoming hours.
Let's also notice that $845 represents the 50% support area of the entire upmove from the October low ($680.75) to the February high ($1007.20), as well as the lower channel line off of the February high. Both also could be “technical magnets” for a forthcoming significant low in spot gold prices and the corresponding SPDR Gold Shares ETF (NYSE: GLD).

Sign up for a free 15-day trial to Mike's ETF Trading Diary today.
By Mike Paulenoff
Mike Paulenoff is author of the MPTrader.com (www.mptrader.com) , a real-time diary of Mike Paulenoff's trading ideas and technical chart analysis of Exchange Traded Funds (ETFs) that track equity indices, metals, energy commodities, currencies, Treasuries, and other markets. It is for traders with a 3-30 day time horizon, who use the service for guidance on both specific trades as well as general market direction
© 2002-2009 MPTrader.com, an AdviceTrade publication. All rights reserved. Any publication, distribution, retransmission or reproduction of information or data contained on this Web site without written consent from MPTrader is prohibited. See our disclaimer.
Mike Paulenoff Archive |
© 2005-2022 http://www.MarketOracle.co.uk - The Market Oracle is a FREE Daily Financial Markets Analysis & Forecasting online publication.


