Gold Some Room for Upside Action
Commodities / Gold & Silver 2009 Apr 12, 2009 - 08:34 AM GMTBy: Merv_Burak

 Other than the sharp drop on Monday it was a quiet week for gold. The volume suggested most traders left the market for the Easter vacation. Next week is another week.
GOLD : LONG TERM

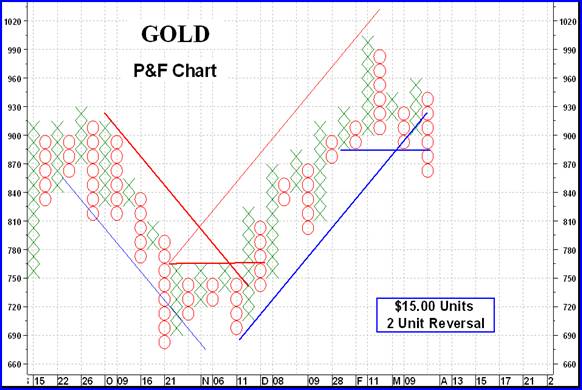
Although most of the week was pretty mild the Monday drop had broken a long term P&F support thereby giving me that second signal (the first being the crossing of the up trend line) for a new bear market. Taking a horizontal count at the break I get a downside projection to $705, which is right where this latest upside move started from. Although the projections have not always been accurate the trend reversals have done good service so I would be inclined to wait before any further action (except shorting) in the market. Once this P&F chart reverses back to the up side one can more comfortably get back in. Of course, for the aggressive speculator, almost anytime is okay to get in, understanding the risks involved.
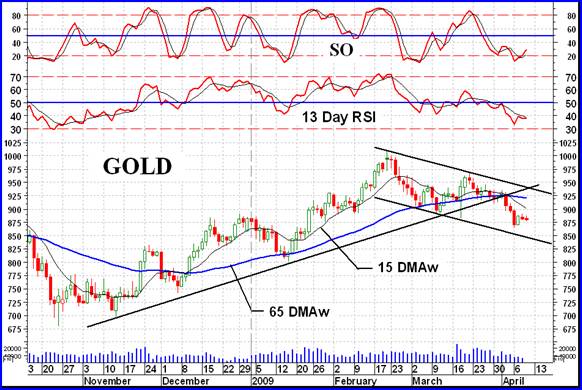
Although the P&F chart has gone bearish the normal chart and indicators are not quite there yet. The gold price closed the week just above its positive sloping moving average line. The momentum indicator remains just above its neutral line in the positive zone although it is below its negative sloping trigger line and heading lower. The volume indicator is moving laterally but with a downward bias and is below its negative trigger line. Still, putting it all together the long term rating remains BULLISH.
INTERMEDIATE TERM
On the intermediate term everything continues to be negative. The gold price remains below its moving average line and the line is sloping downward. The momentum indicator is in its negative zone below a negative trigger line. The volume indicator continues to drift below its negative sloping intermediate term trigger line. All in all, the intermediate term rating remains BEARISH.
SHORT TERM

This is where we would most likely first see a change in trend to the positive but as yet that is not happening. The gold price remains below its negative sloping moving average line and the momentum indicator remains in its negative zone below its negative trigger line. The daily volume action is very low but that could be more due to the Easter holiday period. In any way the rating for the short term remains BEARISH.
As for the immediate direction of least resistance that would be to the down side. There is some small potential for an upside move as the aggressive Stochastic Oscillator (SO) has broken above its oversold line and above its positive trigger line. This, despite the past couple of days of negative price action. We’ll just have to see how this plays itself out.
SILVER
Silver has broken into lower levels similar to gold but unlike gold the P&F chart has not yet issued a bear signal. The previous “handle” pattern that silver price chart was forming is looking less and less like a handle with the past week’s decline. The saucer reversal is still valid but we will now need new rally highs to confirm the saucer reversal message. Other than that the long, intermediate and short term analysis is very much the same as for gold.
Precious Metal Stocks
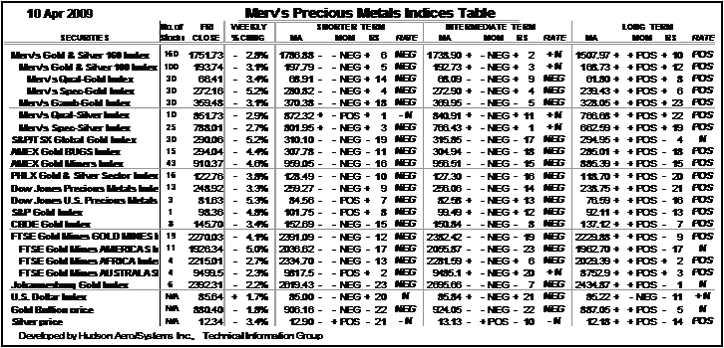
It was an overall negative week for the precious metal stocks. All of my Merv’s Indices were on the down side with a basic uniform decline. No sector of the stocks was leading or lagging in the decline. All the Indices declined by 3% plus or minus a few decimal points. Only the Spec-Gold Index declined outside of this range and that was due to several stocks with double digit declines in the Index.
Looking over the various Indices charts one gets the feeling of a topping going on BUT one still has this nagging feeling “why would gold stocks decline?” With the world economies in turmoil, with pirates and terrorists pushing their weight around in almost all corners of the world one would think that gold, and by implication gold stocks, would be heading for the ceiling. Oh well, that’s the way the markets work, they move to frustrate the most investors/speculators most of the time.
Right now most of the Indices are rated as bearish (NEG) for the short and intermediate term time periods. Things are still bullish (POS) on the long term. How long the long term can hold up, or if the long term will end up to be the strength behind a turn around in the other periods, we’ll just have to wait and see. In the mean time as far as the technical indicators are concerned, now is not the time to be risking major investment capital. Wait for the short and intermediate term technicals to reverse. There are always stocks that move counter to the prevailing market. IF you REALLY are convinced you know which these are then go for it but remember to protect yourself against an unexpected reversal. Capital in hand is more important than a certificate on the decline.
Merv’s Precious Metals Indices Table

Well, that's it another week.
By Merv Burak, CMT
Hudson Aero/Systems Inc.
Technical Information Group
for Merv's Precious Metals Central
For DAILY Uranium stock commentary and WEEKLY Uranium market update check out my new Technically Uranium with Merv blog at http://techuranium.blogspot.com .
During the day Merv practices his engineering profession as a Consulting Aerospace Engineer. Once the sun goes down and night descends upon the earth Merv dons his other hat as a Chartered Market Technician ( CMT ) and tries to decipher what's going on in the securities markets. As an underground surveyor in the gold mines of Canada 's Northwest Territories in his youth, Merv has a soft spot for the gold industry and has developed several Gold Indices reflecting different aspects of the industry. As a basically lazy individual Merv's driving focus is to KEEP IT SIMPLE .
To find out more about Merv's various Gold Indices and component stocks, please visit http://preciousmetalscentral.com . There you will find samples of the Indices and their component stocks plus other publications of interest to gold investors.
Before you invest, Always check your market timing with a Qualified Professional Market Technician
Merv Burak Archive |
© 2005-2022 http://www.MarketOracle.co.uk - The Market Oracle is a FREE Daily Financial Markets Analysis & Forecasting online publication.


