


Gold and Crude Oil at Critical Tipping Point
Commodities / Gold & Silver 2009 Apr 12, 2009 - 05:52 PM GMTBy: Chris_Vermeulen

 Gold and oil traders have been on edge for the past few weeks wondering if prices will drop or rally from this correction/pause in prices. You will see in the charts below that gold and oil are at points where they could go either way very quickly. The are currently balancing at key technical points and we will wait for the tipping point.
Gold Analysis
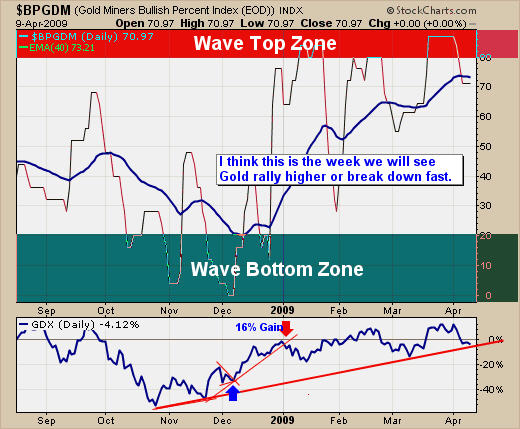
The bullish percent index for gold mining stocks helps point out how bullish the gold sector is. Currently gold stocks look to be strong. This chart shows that we are near a possible wave top and could see lower prices in the near future. The Problem with this indicator is that it can hold these high levels for extended periods of time and gold could just keep moving higher and higher.
So now what? Which way is the gold sector going?
Well Indicators are very helpful for pointing out trends and possible pivot points; I do not believe you can trade with them alone. In my opinion trading the price action of gold and gold stocks is the way to do it. Until we get a bounce or breakout with a low risk setup its best not to do anything.
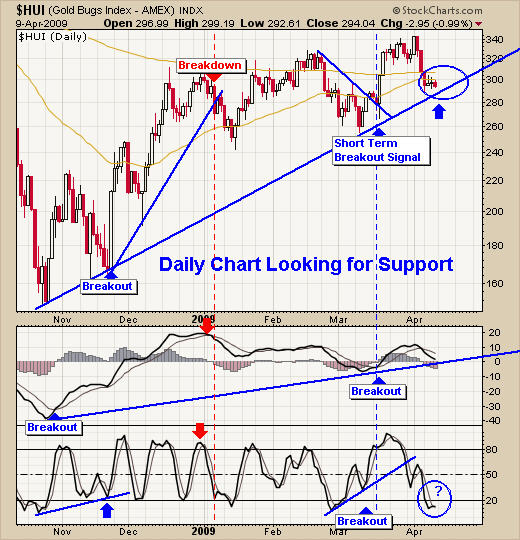
Gold Stock Trading
Gold stocks are currently trading near support. This week we should see a substantial move higher or lower. Only time will tell.
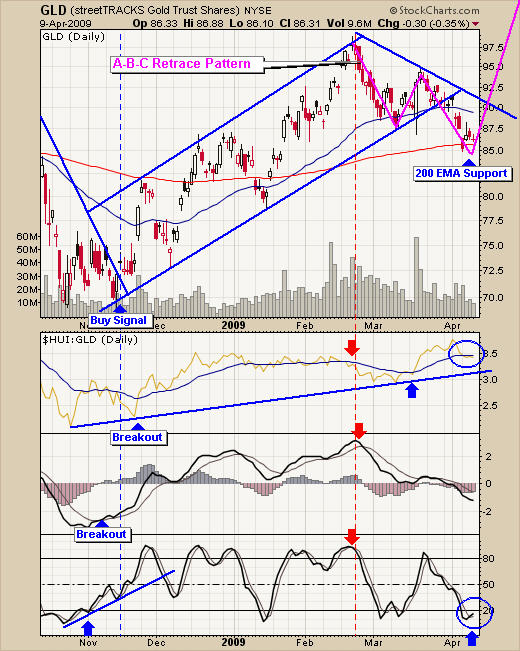
Gold Price Trading
Gold has been consolidating for about 6 weeks and has formed two patterns. One is a head and shoulder reversal pattern and has broken its neck line already. The other is a simple A-B-C correction which is what I have drawn on the chart.
Why did I only show the A-B-C correction? Both patterns are simple to see so I only high lighted one pattern which puts enough noise on the chart, I am all about keeping it simple.
I am favoring the long side currently for gold. Don’t get me wrong I am not bias in my trading, I am more than happy to go short at any time, but for this report I want to stick with the Trend Is Your Friend mentality.
Gold is currently trending up and after rallies we get pauses or consolidations as traders take profits and new traders start to accumulate long positions.
- Gold miners Bullish Percent index is a bullish.
- Simple A-B-C consolidation pattern.
- Gold is currently trading at support from the December wave top.
- Gold is currently trading at the 200 Moving average which can act support.
- Gold stocks are holding more value than the price of gold (bullish for gold).
- Stochastic indicator is bottoming and starting to hook up for positive momemtum.
Technically Trading Gold
Trading gold can be a very frustrating experience. I will admit it’s been much harder than normal, and the past 6 months with volatility levels through the roof it’s difficult for getting low risk setups in both gold and gold stocks.
Knowing when to pull the trigger is the most difficult part of trading and that is why you must have a strategy in place which will minimize your risk per trade and your money is working for you when the odds are on your side. I use a very simple trading model which only generates 10-30 trades per year in gold. I believe you do not need to trade every week to make a living from the markets.
If you would like more information on my trading model or to receive my Free Weekly Trading Reports - Click Here
I have put together a Recession Special package for yearly subscribers which is if you join for a year ($299) I will send you $300 FREE in gas, merchandise or grocery vouchers FREE which work with all gas stations, all grocery stores and over 100 different retail outlets in USA & Canada.
If you interested please act fast before they are gone for good.
If you would like to receive my free weekly market updates please visit my website: www.TheGoldAndOilGuy.com
I look forward to hearing from you soon!
By Chris Vermeulen
Chris@TheGoldAndOilGuy.com
Please visit my website for more information. http://www.TheGoldAndOilGuy.com
Chris Vermeulen is Founder of the popular trading site TheGoldAndOilGuy.com. There he shares his highly successful, low-risk trading method. For 6 years Chris has been a leader in teaching others to skillfully trade in gold, oil, and silver in both bull and bear markets. Subscribers to his service depend on Chris' uniquely consistent investment opportunities that carry exceptionally low risk and high return.
This article is intended solely for information purposes. The opinions are those of the author only. Please conduct further research and consult your financial advisor before making any investment/trading decision. No responsibility can be accepted for losses that may result as a consequence of trading on the basis of this analysis.
Chris Vermeulen Archive |
© 2005-2022 http://www.MarketOracle.co.uk - The Market Oracle is a FREE Daily Financial Markets Analysis & Forecasting online publication.