


China Exchange Traded Fund (FXI) Rises off its Double Bottom Leaving Investors Cautiously Optimistic
Stock-Markets / Chinese Stock Market Apr 18, 2009 - 11:57 AM GMTBy: Oxbury_Research

 In this type of economic environment, a double bottom “bullish reversal” formation is surely a site for sore eyes. This technical pattern is made up of two consecutive troughs with a minor peak in the middle. Add that to an upside breakout of an overall downward trendline and you’re looking at some good bullishness.
China has taken its fair share of beatings over the past year which is reflected in the weekly price chart below. The beginning stages of this bottom were set in place by a bullish crossover on the MACD when the (12, 26) moving average line in blue suddenly jumped above its counterpart, the EMA (9) line shown in red.
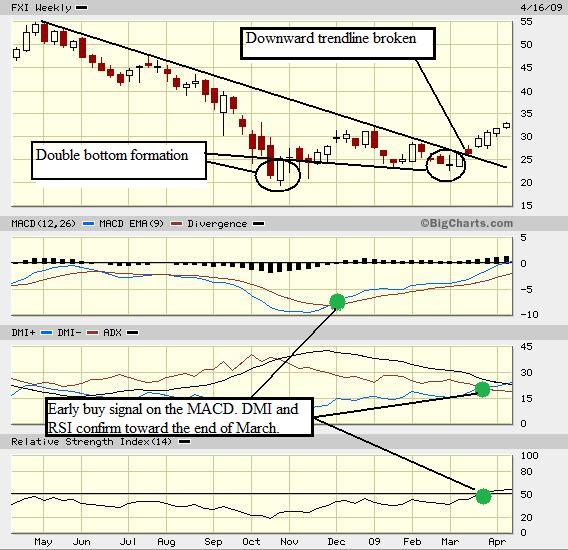
The only thing preventing the China ETF (FXI) from taking off was the Directional Movement Index (DMI), which finally gave in to bullish pressures and formed a positive crossover of its own between the DMI+ and DMI- blue and red lines.
Additionally, I have targeted the key point where the Relative Price Strength (RSI) indicator broke through its own psychological barrier at the halfway 50 mark for the first time since early 2008. For each of these indicators I have marked the point of reversal with a green dot.
While I do believe the FXI has a good shot at gaining more ground, I would like to mention that investors only remain cautiously optimistic here. The reason for this warning being that there is stiff resistance near $40/share. Additional, it is worthwhile to note that the recent breakout from its downward trend line was accomplished on below average volume, which isn’t great for those looking to ride the uptrend for a while.
Keep your eyes open and enjoy the short-term ride.
Good investing,
Stanley Barnes
Analyst, Oxbury Research
Disclosure: no positions
Oxbury Research originally formed as an underground investment club, Oxbury Publishing is comprised of a wide variety of Wall Street professionals - from equity analysts to futures floor traders – all independent thinkers and all capital market veterans.
© 2009 Copyright Oxbury Research - All Rights Reserved
Disclaimer: The above is a matter of opinion provided for general information purposes only and is not intended as investment advice. Information and analysis above are derived from sources and utilising methods believed to be reliable, but we cannot accept responsibility for any losses you may incur as a result of this analysis. Individuals should consult with their personal financial advisors.
Oxbury Research Archive |
© 2005-2022 http://www.MarketOracle.co.uk - The Market Oracle is a FREE Daily Financial Markets Analysis & Forecasting online publication.