


The Sock Market Raging Bulls
Stock-Markets / US Stock Markets May 20, 2007 - 07:12 PM GMTBy: Joseph_Russo
 Two weeks ago, we shared with readers a perception that equity markets were bullish like no tomorrow . That general assessment has held course thus far. However, intermediate level timing models are suggesting that equity markets may be fast approaching a juncture of pivotal import. If so, many broad market indices will soon elect one of three critical paths in the days and weeks ahead. Our continued diligence monitoring minor degree trends, together with intra-day price structures; enables us to anticipate which of these critical paths each market is in the process of adopting.
The surge in equity prices from March appears driven by a healthy dose of animal spirits. Of late however, neither momentum measures nor sound fundamental metrics appear plausible enough to account fully for the unprecedented two-month rise in prices.
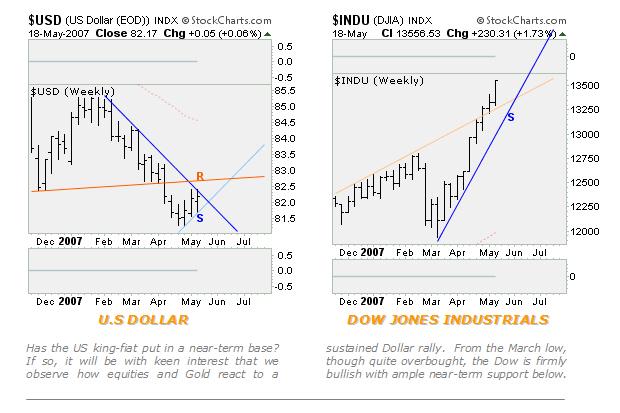
It is clear that some form of exuberance is taking hold of equity indices. As the US Dollar gasps for air, equity markets continue to press higher in a raging bull market that is historically over-extended, overbought, and extremely mature. That said - one must be aware that equities are subject to another February-like decline without any particular notice.
Despite such imminent prospects, the recent buying-panic in select indices may well persist for much longer than one might assume. Once the surge abates, rather than a sharp decline, Act-II may bring with it a sideways levitation, serving to work off extreme overbought conditions, and perhaps introduce prospects for a summer consolidation. In either case, it is advisable that one stay tuned for the new fall season.
last week's short-term navigational GUIDANCE
![]()
This segment highlights one of many indices and time-horizons covered in the Near Term Outlook. Such exercise intends to reflect upon the worth of forecasting accuracy from the preceding period's guidance. Top honors for short-term directional guidance from last week go to the NASDAQ 100.
Previous Week's Statistical Summary for the NASDAQ 100 :
Weekly data points
• Open - 1901.66
• High - 1906.38
• Low - 1866.96
• Close – 1896.93 -0.24%
• Range - 39.42 pts 2.07%
• Total Navigation Points Captured – 71 pts +3.73%
• Short-Term Trader's Profitability Assumption * – 42.60 pts +2.24%
*Allowing for entry, slippage, and commission- the profitability assumption above reflects a 40% margin-buffer subtracted from the total navigation points captured by guidance.
From Elliott Wave Technology's Near Term Outlook for the week ending May 18, 2007
Our short-term guidance rolled into last week's trade from the long side. Our bullish stance arrived courtesy of a buy-signal issued against the previous Thursday's May 10 low of 1874.24. The day following this signal, the NDX opened with a 3-point gap-up, and settled the session 23-points higher on the day. As such, we began last week on a rather profitable note.
Monday, May 14 – Pre Open Report
In our first report to start the week, we stated clearly that an anticipated follow-through rally, stemming from a breakout above the previous day's large range inside session, was likely to be short-lived.
In the form of a trendline break (TLB) carrying a minimum downside reversal target of 15-points beneath its breakdown apex, we graphically illustrated how and where the first sign of such failure would manifest.
Monday, May 14 – Opening Bell
After a huge gap-up open at the bell, the NDX surged straight up to its print-high for the week at 1906.38. Then suddenly, the rally failed, reversing course with fierce bearish abandon.
Upon the hard-down reversal, the market tripped beneath our resting (TLB) apex at 1896.07, electing a SAR (stop and reverse) sell-trigger, prompting short-term traders to take profits on longs and reverse to the short side of the market.
Thereafter, not only did the market retract all of Monday's gains, but also erased all of the gains amassed from the previous Friday as well. The NDX hit an intraday low of 1878.63 (a 27-pt intra-day reversal) before settling the session at 1885.58, down -16.08 on the day.
From Elliott Wave Technology's Near Term Outlook for the week ending May 18, 2007
Last Monday's report also mentioned the likelihood that there was fair potential that such a rally failure would likely engender a bout of choppy trading dynamics short-term.
Wednesday, May 16 – Pre Open Report
The second of our three weekly reports, highlighted a short-term buy-signal against Tuesdays 1870.24 low. Additionally, under this reports proprietary turn-date chart, we stated, “nothing would be finer than to see a marginal new low for the move (Wednesday), followed by a reaction rally of merit.”
Wednesday, May 16 – Opening Bell
After a brief 4th-wave gap-up after the bell, the market quickly reversed to print the anticipated new low at 1866.98 (3.26 pts below Tuesdays). This low provided a gracious secondary queue for short-term traders to take profits on any remaining shorts, and SAR long the NDX.
Thereafter, from Wednesday's intra-day low of 1866.98, the NDX mounted a robust 24-pt rally, ending the session at 1891.57 near the highs of the day.
Friday, May 18 – Pre Open Report
In our last report for the week, we began by noting two bullish pattern triggers residing above the market. Additionally, we stressed that recent market conditions were being governed by failure or success of the numerous short-term pattern triggers buried amid intra-day price action. Thursday's session closed on a sour note down -6.89 on the day. We noted that per the close, by way of a marginally negative pattern-breach, that bears had a slight upper hand going into Friday's trade. We clearly identified, precisely where this bearish trigger-line rested, drawing a clear line in the sand as to where it would begin to succeed or flat-out fail. Note: In the interest of preserving proprietary methodology for clients, along with specific price projections and larger degree wave labels, we have removed all past and forward trigger-lines, from the above chart.
Friday, May 18 –Opening Bell
Friday's opening bell ushered in another gap higher, which immediately negated the marginal bearish trigger-line violation noted from Thursdays close. Within the first hour of trade, both of the overhead pattern buy-triggers specified in our report had triggered. The NDX went on to finish the session up +12.25 closing the week at 1896.93 , up 29.95 from its low, but down marginally -0.24% from Monday's open.
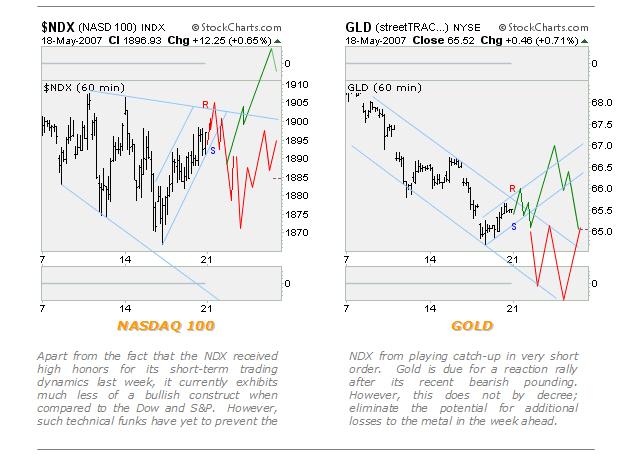
intra-day snapshots for the week ahead
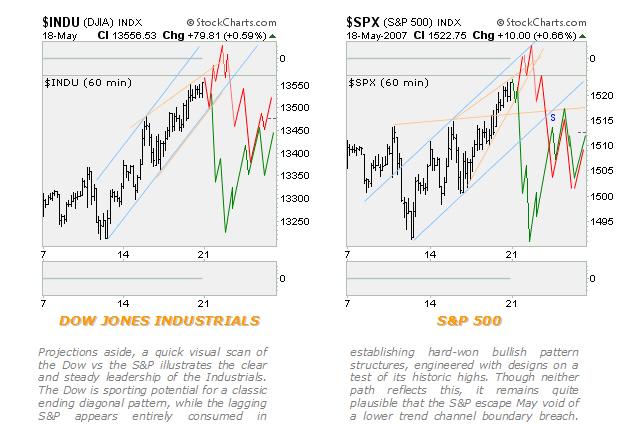
![]()
In this segment, we share with readers a collection of intra-day charts that span the preceding two weeks. Each index includes forward-looking graphics, which illustrate plausible variant price paths for the week directly ahead.
Bear in mind that such price path projections are by no means forecasts. Such projections do not in any way to reflect our branded market guidance, nor are they to be interpreted as trade recommendations of any type.
The intent of such projections is to provide advance consideration for one or more plausible paths residing amid a much broader range of variant outcomes.
Disciplined monitoring of intra-day wave structures enables us to quickly confirm or negate any of the plausible paths set forth. Through this process, we readily identify the development of variant patterns as dynamic price structures evolve .
The Near Term Outlook delivers unrivaled short and long-term forecasting guidance for the U.S Dollar, Dow, SPX, Gold, HUI, and NDX.
The concise, impartial market guidance, consistently present throughout this publication, provides clear targets, triggers, and variant parameters from which active traders can successfully construct low-risk trading strategies. The long-term rewards in adopting such guidance as part of one's trading arsenal are quite substantial, and well worth the risk.
In closing, we wish to remind readers that the rigors and discipline we employ in delivering such guidance is by no means arcane. Our methodology is fully transparent, and clearly translated, providing a lifelong benefit of advanced trading skills to each of our clients. We do not predict prices, nor are we ever tied to a fixed bias or singular perception; instead, we adapt to the price action as it unfolds. As evidenced in reviewing our prior week's guidance, the competitive edge is most notable.
Trade Better / Invest Smarter…
By Joseph Russo
Chief Editor and Technical Analyst
Elliott Wave Technology
Copyright © 2007 Elliott Wave Technology. All Rights Reserved.
Joseph Russo, presently the Publisher and Chief Market analyst for Elliott Wave Technology, has been studying Elliott Wave Theory, and the Technical Analysis of Financial Markets since 1991 and currently maintains active member status in the "Market Technicians Association." Joe continues to expand his body of knowledge through the MTA's accredited CMT program.
© 2005-2022 http://www.MarketOracle.co.uk - The Market Oracle is a FREE Daily Financial Markets Analysis & Forecasting online publication.