


Gold and Silver Analysis - Precious Points: A Bounce is a Bounce
Commodities / Gold & Silver May 20, 2007 - 09:15 PM GMTBy: Dominick

“A continuation of reverses (signaling continued weakness) would most likely continue to trigger liquidation of large gold positions and put downward pressure on metals… What gold needs to get its groove back is a rebound in the economy with an uptick in inflation.” ~Precious Points: Don't Fear the Repo , May 13, 2007
The Fed continued reducing the money supply this week by failing to place as many dollars through repos as were removed at maturity. Not surprisingly then, metals continued their downward slide through the early part of last week.
But, as expressed in the previous update, signs of a resilient economy began the recovery and, in fact, gold and silver put in short term bottoms on Thursday once investors digested optimistic statements by Chairman Bernanke and the drop in jobless claims. Rate cut odds receded, as priced by the Fed funds futures, and Friday's stronger than expected consumer sentiment sealed the deal, confirming what the trend cycle charts were already suggesting was a tradeable bounce at Thursday's close.
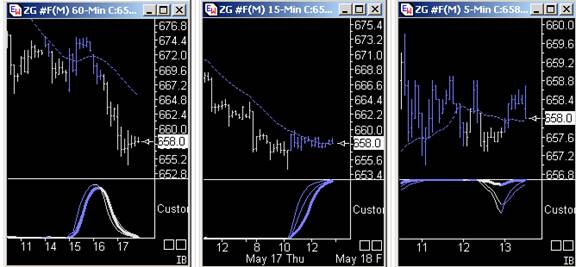
The 60min chart went positive (blue) during the first hour of trading Friday morning and closed just slightly above the blue, dotted moving average line, suggesting a continuation of the rally lies ahead. There's little news next data, economic or earnings, but traders should remain cautious and not assume a quick bounce is the start of a new uptrend.
Gold and silver rallied Friday despite a surge in the dollar against the Euro and the Yen, and in the face of a triple-pronged tightening effort in China . Metals could continue Friday's run if this rally in the dollar reverses and takes out new lows, but because it will probably be very difficult to stage a run to new highs in the face of a strengthening or even steady dollar, and the attractiveness of U.S. markets has been has seemed to put a floor in the dollar index. Platinum traded along the same general lines as gold and silver, and the chart from last week continues to suggest the likely target for this move.
Metals seemed to get a boost from stocks, perhaps because of hedging or allocation maintenance, Week in and week out, stocks have gone higher and higher on foreign investment and multinational profits, as the United States' accommodative money markets remain an appealing home for foreign capital, but for the most part, metals have not gone along for the ride.
Supply and demand of real physical metal continues to be a major factor in preventing a freefall selloff in metals, but as mentioned in several previous updates, it's investor demand that creates most of the price action in metals… and to put it mildly, metals have not been attracting much investor attention lately.
Months ago, the Fed threatened that slowing growth would dampen inflation and they seem to have gotten their wish. Despite robust bank lending, M2 has actually started a mild contraction and the Fed has reduced the total volume of it's sloshing repo funds for four consecutive weeks. The last round of inflation data was relatively tame and the net result has been stagnation in the metals bull.
This update is on the record as saying that gradual deflating of the bubble in China 's red-hot stock market would benefit metals long term if it prevents a collapse. There's speculation that the recent spike in bond yields is a result in China swapping out of a large chunk of their U.S. Treasuries holdings, which could also be a motivation for the Fed's recent stinginess. The gradual rising trend in global interest rates is only beneficial to metals if it does not begin to flatten inflation readings, and with China starting to apply the breaks, the best way to maintain this is through a resurgence in the U.S. economy.
So, consumer confidence helped end the week on a positive note, but consumer confidence is not consumer spending, and that's what will ultimately have to continue if the economy is going to turn around. If China is partly responsible for the selloff in bonds, then there isn't as much economic optimism as might otherwise be read into the spike in yields. Until the economy recovers, new highs in the metals aren't on the way, and, if the downside seems at least for the time being to be limited, the reality continues to be more of the rangebound trading this update has been expecting for weeks.
In the alternative, stocks could be overextended and due for a pullback, and metals probably won't provide much cover. The silver chart below illustrates such a scenario. Having violated the trendline, the critical levels to watch are the 50-day moving average on the weekly chart just above $12.50 (the bottom end of the expected range), and the previous lows at about $12.50 and $12. Losing the first level suggests a move to at least the second. If silver holds the previous swing at the $12.50 area, it may have another up move in it, but if not, we may have already seen an intermediate term top, which brings the 200-day moving average into play.
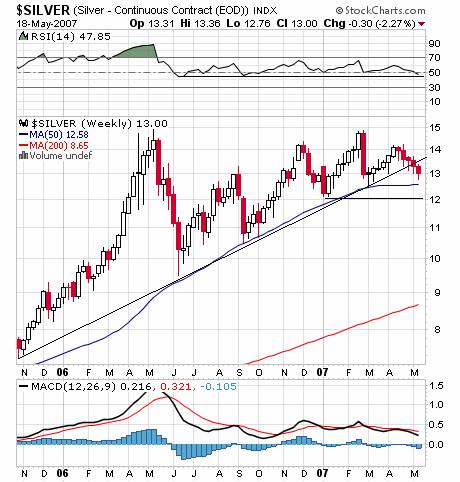
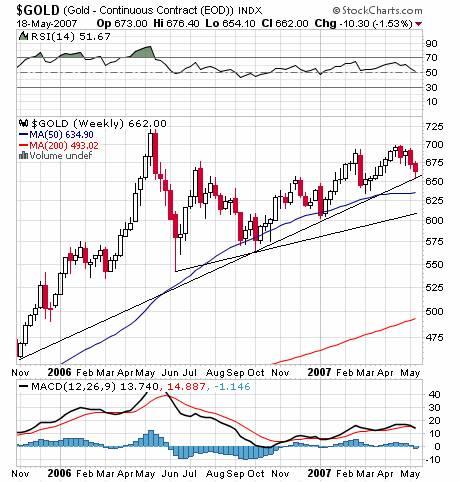
RSI hints that silver is at or near a bottom, and if stocks continue to move into a parabolic ascent, the metals will probably be spared a selloff, at least while the rally is on. For gold, risk of a double top at $700 becomes the challenge in that case. The chart below shows gold catching support last week at the multi-year trendline. If this level is lost, the 50-day moving average represents support in the $635 area. Even a decline to $610 would preserve the uptrend from the June '06 lows.
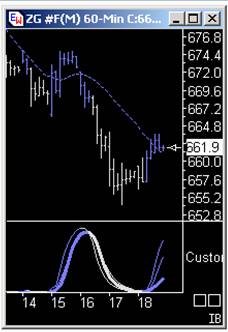
TTC's proprietary 60min trend chart is looking for this move to continue, but that doesn't necessarily require a dramatic change in price. In fact, the entire previous up-cycle, a period of about 2 days and 6 points, is still pictured in the chart below, suggesting that sometimes a bounce is just a bounce.
But the purpose of this update is not to provide ideas for intraday trades, just to discuss larger week-to-week trends in metals. For short term futures trading, you'll want to use the trend cycle charts and the good people at TTC, where membership is still just $50 for a month … but not for long!
by Joe Nicholson (oroborean)
© 2005-2022 http://www.MarketOracle.co.uk - The Market Oracle is a FREE Daily Financial Markets Analysis & Forecasting online publication.