Most Popular
1. It’s a New Macro, the Gold Market Knows It, But Dead Men Walking Do Not (yet)- Gary_Tanashian
2.Stock Market Presidential Election Cycle Seasonal Trend Analysis - Nadeem_Walayat
3. Bitcoin S&P Pattern - Nadeem_Walayat
4.Nvidia Blow Off Top - Flying High like the Phoenix too Close to the Sun - Nadeem_Walayat
4.U.S. financial market’s “Weimar phase” impact to your fiat and digital assets - Raymond_Matison
5. How to Profit from the Global Warming ClImate Change Mega Death Trend - Part1 - Nadeem_Walayat
7.Bitcoin Gravy Train Trend Forecast 2024 - - Nadeem_Walayat
8.The Bond Trade and Interest Rates - Nadeem_Walayat
9.It’s Easy to Scream Stocks Bubble! - Stephen_McBride
10.Fed’s Next Intertest Rate Move might not align with popular consensus - Richard_Mills
Last 7 days
CEREBUS IPO NVIDIA KILLER? - 18th Dec 24
Nvidia Stock 5X to 30X - 18th Dec 24
LRCX Stock Split - 18th Dec 24
Stock Market Expected Trend Forecast - 18th Dec 24
Silver’s Evolving Market: Bright Prospects and Lingering Challenges - 18th Dec 24
Extreme Levels of Work-for-Gold Ratio - 18th Dec 24
Tesla $460, Bitcoin $107k, S&P 6080 - The Pump Continues! - 16th Dec 24
Stock Market Risk to the Upside! S&P 7000 Forecast 2025 - 15th Dec 24
Stock Market 2025 Mid Decade Year - 15th Dec 24
Sheffield Christmas Market 2024 Is a Building Site - 15th Dec 24
Got Copper or Gold Miners? Watch Out - 15th Dec 24
Republican vs Democrat Presidents and the Stock Market - 13th Dec 24
Stock Market Up 8 Out of First 9 months - 13th Dec 24
What Does a Strong Sept Mean for the Stock Market? - 13th Dec 24
Is Trump the Most Pro-Stock Market President Ever? - 13th Dec 24
Interest Rates, Unemployment and the SPX - 13th Dec 24
Fed Balance Sheet Continues To Decline - 13th Dec 24
Trump Stocks and Crypto Mania 2025 Incoming as Bitcoin Breaks Above $100k - 8th Dec 24
Gold Price Multiple Confirmations - Are You Ready? - 8th Dec 24
Gold Price Monster Upleg Lives - 8th Dec 24
Stock & Crypto Markets Going into December 2024 - 2nd Dec 24
US Presidential Election Year Stock Market Seasonal Trend - 29th Nov 24
Who controls the past controls the future: who controls the present controls the past - 29th Nov 24
Gold After Trump Wins - 29th Nov 24
The AI Stocks, Housing, Inflation and Bitcoin Crypto Mega-trends - 27th Nov 24
Gold Price Ahead of the Thanksgiving Weekend - 27th Nov 24
Bitcoin Gravy Train Trend Forecast to June 2025 - 24th Nov 24
Stocks, Bitcoin and Crypto Markets Breaking Bad on Donald Trump Pump - 21st Nov 24
Gold Price To Re-Test $2,700 - 21st Nov 24
Stock Market Sentiment Speaks: This Is My Strong Warning To You - 21st Nov 24
Financial Crisis 2025 - This is Going to Shock People! - 21st Nov 24
Dubai Deluge - AI Tech Stocks Earnings Correction Opportunities - 18th Nov 24
Why President Trump Has NO Real Power - Deep State Military Industrial Complex - 8th Nov 24
Social Grant Increases and Serge Belamant Amid South Africa's New Political Landscape - 8th Nov 24
Is Forex Worth It? - 8th Nov 24
Nvidia Numero Uno in Count Down to President Donald Pump Election Victory - 5th Nov 24
Trump or Harris - Who Wins US Presidential Election 2024 Forecast Prediction - 5th Nov 24
Stock Market Brief in Count Down to US Election Result 2024 - 3rd Nov 24
Gold Stocks’ Winter Rally 2024 - 3rd Nov 24
Why Countdown to U.S. Recession is Underway - 3rd Nov 24
Stock Market Trend Forecast to Jan 2025 - 2nd Nov 24
President Donald PUMP Forecast to Win US Presidential Election 2024 - 1st Nov 24

Market Oracle FREE Newsletter

How to Protect your Wealth by Investing in AI Tech Stocks

Gold Today and Nasdaq 1995, Secular Bull Market Fundementals

Commodities / Gold & Silver 2009 May 07, 2009 - 11:22 AM GMT

By: Jordan_Roy_Byrne

Commodities

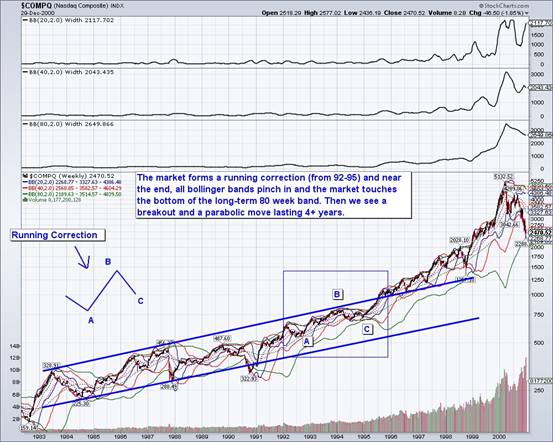
Best Financial Markets Analysis ArticleThere are technical and fundamental similarities in all bull markets. In the case of Gold today and the Nasdaq in the mid 1990s, there are several key technical similarities. I will show these in two charts. 


In this case there are three important similarities. There is a running correction for a few years, the squeezing in of several bollinger bands and finally, a breakout from the price channel. Below is a chart of the Nasdaq. The running correction occurred from 1992 to 1995. As the market began its parabolic ascent (in 1995), all the bollinger bands (20, 40 and 80 week) were squeezed in which suggests a strong move in all time frames. Each time the market touched the lower 80-week band (1984, 1987, 1990, 1994, 1998) proved to be a very important low.
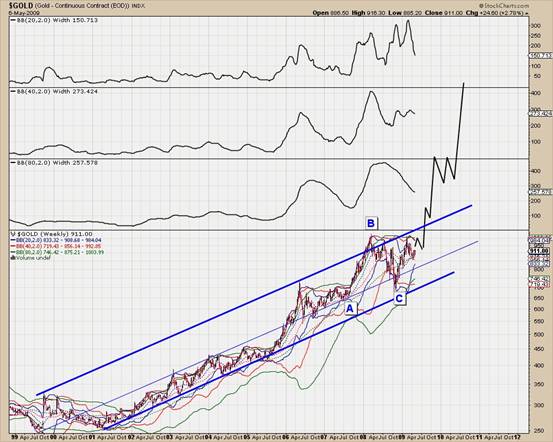
The same things are evident in Gold’s chart below. The action since May of 2006 has been a running correction. We showed the form in the last chart. (Essentially, the counter-trend “B” move advances to a new high followed by a “C” decline that bottoms right at or near the previous impulsive top, which in this case is May 2006). Secondly, all of the bollinger bands are squeezing in. The market already touched the lower 40-week band, which hadn’t happened since 2005. The market came very close to touching the lower 80-week band. That hasn’t happened since 2001. A correction of primary degree is in the later stages. 
Conclusion

These charts show how secular bull markets move from steady and gradual to parabolic. The transition involves a long corrective period that is difficult to correctly diagnose until its later stages. The bollinger bands are extremely helpful as they allow us to measure volatility across all time frames. For Gold, its primary correction is near its end while the short and medium term corrections may have a bit more time to go. We’d like to see volatility in those time frames compress a bit more. Stay tuned for our next update, as we’ll have more insightful charts.

By Jordan Roy-Byrne
trendsman@trendsman.com
Editor of Trendsman Newsletter
http://trendsman.com

Trendsman” is an affiliate member of the Market Technicians Association (MTA) and is enrolled in their CMT Program, which certifies professionals in the field of technical analysis. He will be taking the final exam in Spring 07. Trendsman focuses on technical analysis but analyzes fundamentals and investor psychology in tandem with the charts. He credits his success to an immense love of the markets and an insatiable thirst for knowledge and profits.

Jordan Roy-Byrne Archive

© 2005-2022 http://www.MarketOracle.co.uk - The Market Oracle is a FREE Daily Financial Markets Analysis & Forecasting online publication.


Post Comment

Only logged in users are allowed to post comments. Register/ Log in