Stocks, Gold and Silver ETF Trading Outlook & Forecasts
Commodities / Forecasts & Technical Analysis May 21, 2009 - 04:52 AM GMTBy: Chris_Vermeulen
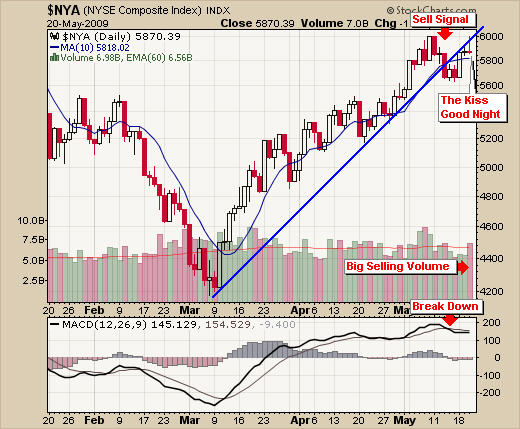
 The broad market has been moving higher with great force the past 2 months. I have been expecting a top for the past 2-3 weeks. It looks like the market is starting to come in (sell off).
Few quick points which I think are interesting:
- Gold started to sell off about 10 days before equities rallied as money was pulled from the golden safe haven and rotated back into stocks. Now gold is moving higher and the broad market is starting to roll over.
- I find the broad market moves in 6-8 week cycles and it looks like the market peaked last week (week 8).
- Looks like we had some capitulation volume during the top last week and big selling again today as equities tested the high.
- Trading inverse etf funds I find are the best way to take advantage of this possible setup. Members will be able to profit from the lowest risk setup I can find.
The Gold Sector
Gold had a nice move higher today with fears of inflation, the broad market correcting and the USD which is dropping like a rock. I have provided a few charts to help you get a better view of what’s happening and how I see things.
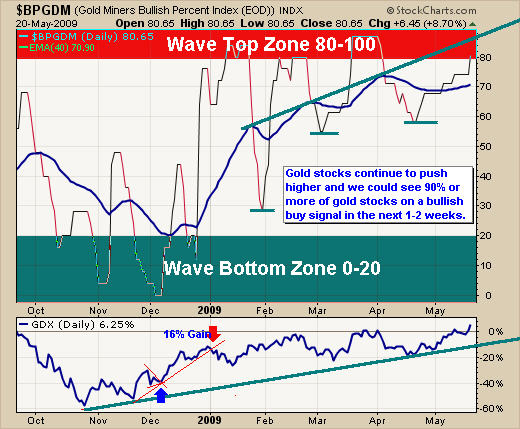
The Bullish Percent Index of Gold Miner Stocks
This chart tells us the percentage of gold mining stocks which are currently on a point and figure buy signal. Currently 80% of gold stocks are in a bullish chart pattern and the good news is that we can still see this chart move to the 90 and even 100 level.
I like to watch this chart for short term over bought or over sold levels which occurs when this chart is in the Wave Top or Wave Bottom Zones. This allows me to tighten my stops to lock in short term profits.
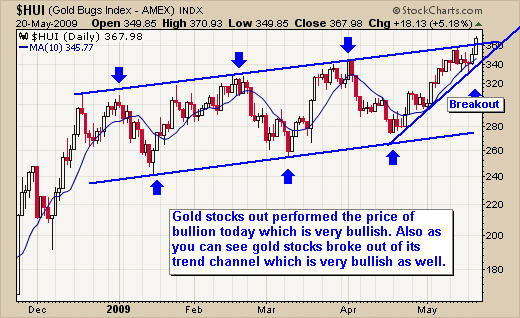
Gold Stocks Price Action
As you can see from the chart below, gold stocks broke out of their trend channel this week. It will be exciting to watch and see what happens over the next few days. This type of price action is what the broad market did in March and April. As prices break through the top trend line we could very well see a jump in prices as investors panic and buy into gold stocks so they do not miss the next move.
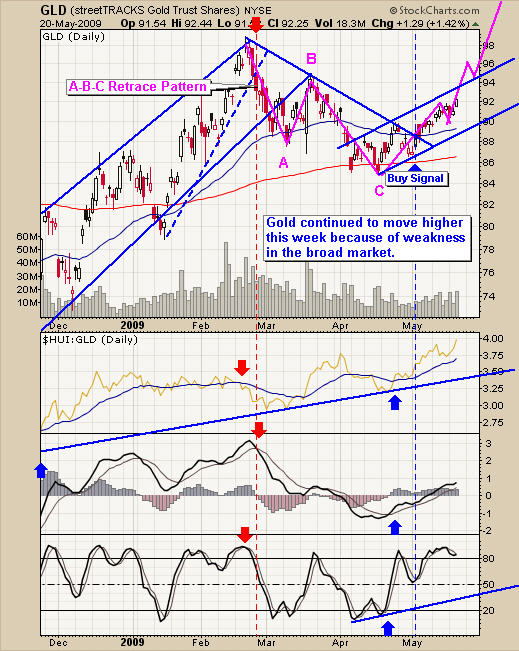
Gold GLD Active Trading Chart
Gold looks like it wants to run higher but it will find resistance at the upper channel trend line. If this price level is breached then I think we will see gold surge much higher.
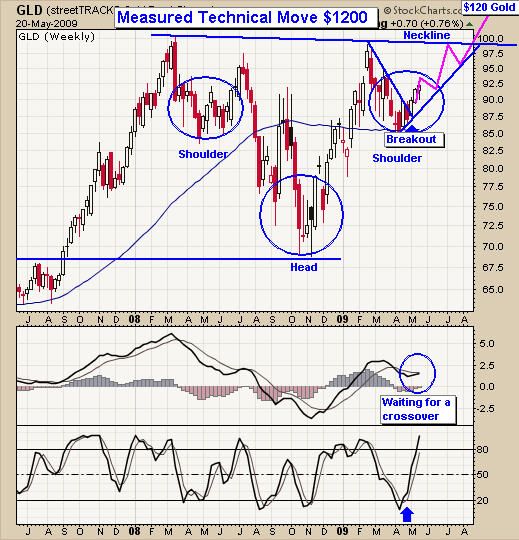
Weekly View of Gold
Here is a quick look at the weekly chart of gold. It shows that prices may take a few months for gold to retest the $1000 level if the trend continues higher. The large reverse head and shoulders pattern looks very promising for higher prices as well.
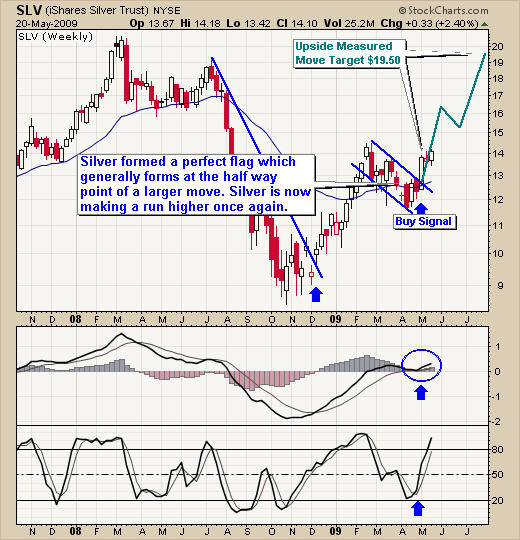
Weekly Silver Active Trading Chart
This chart clearly shows the potential that silver has over the next few months.
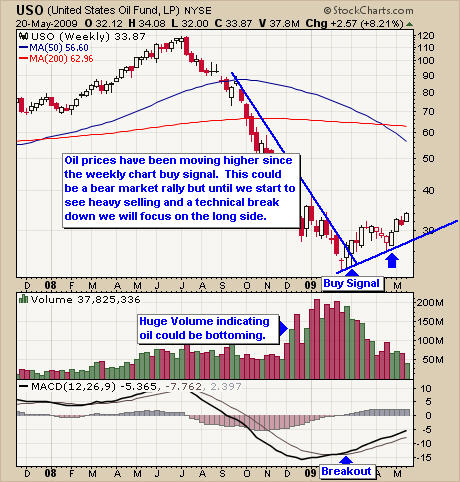
Crude Oil Active Trading – Weekly Chart
Crude oil made a new 6 month high this week. Money has been flowing into commodities the past couple weeks as traders and investors try to protect them selves from the over bought equities market. This weekly chart and really most weekly charts generate clean buy and sell breakout signals.
TheGoldAndOilGuy Trading Conclusion:
I think gold and silver will do very well over the next couple weeks. Depending on how strong the pullback is for equities it will play a roll in the price of precious metals. If we get a really strong reversal and rally then I don’t think gold and silver will do as well.
Looking at oil it’s more difficult to say what could happen. If the equities market drops fast then I think it will pull oil with it as investors lose confidence and oil demand will continue to decrease.
We have some very exciting opportunities ahead of us and its important that we keep our risk low while taking advantage of current market swings using stocks, etf’s and commodities. My focus is to keep overall risk under 3%
Hello, I'm Chris Vermeulen founder of TheGoldAndOilGuy and NOW is YOUR Opportunity to start trading GOLD, SILVER & OIL for BIG PROFITS. Let me help you get started.
If you would like more information on my trading model or to receive my Free Weekly Trading Reports - Click Here
I have put together a Recession Special package for yearly subscribers which is if you join for a year ($299) I will send you $300 FREE in gas, merchandise or grocery vouchers FREE which work with all gas stations, all grocery stores and over 100 different retail outlets in USA & Canada.
If you have any questions please feel free to send me an email. My passion is to help others and for us all to make money together with little down side risk.
To Your Financial Success,
By Chris Vermeulen
Chris@TheGoldAndOilGuy.com
Please visit my website for more information. http://www.TheGoldAndOilGuy.com
Chris Vermeulen is Founder of the popular trading site TheGoldAndOilGuy.com. There he shares his highly successful, low-risk trading method. For 6 years Chris has been a leader in teaching others to skillfully trade in gold, oil, and silver in both bull and bear markets. Subscribers to his service depend on Chris' uniquely consistent investment opportunities that carry exceptionally low risk and high return.
This article is intended solely for information purposes. The opinions are those of the author only. Please conduct further research and consult your financial advisor before making any investment/trading decision. No responsibility can be accepted for losses that may result as a consequence of trading on the basis of this analysis.
Chris Vermeulen Archive |
© 2005-2022 http://www.MarketOracle.co.uk - The Market Oracle is a FREE Daily Financial Markets Analysis & Forecasting online publication.


