


Gold Bullish Trend Boosted by Sharp Drop in the U.S. Dollar
Commodities / Gold & Silver 2009 May 24, 2009 - 01:07 PM GMTBy: Merv_Burak

 The week started out on a sour note but ended up okay. Gold seems now to be more comfortable on the up side. The sharp drop in the U.S. dollar isn’t hurting any.
U.S. Dollar Index
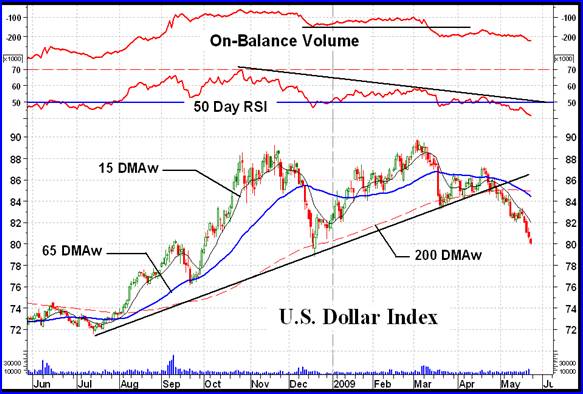
I get into the U.S. $ Index every now and then. I was planning to talk about it briefly over the past several weeks but I just kept putting it off. Well, here it is and Obama’s stimulus program is really working as expected. Unfortunately, many analysts are convinced that this is just the start of the U.S. $ plunge. Trillions in debt, what could possibly go wrong?
The decline in the $ does not come as a surprise to a technician watching the chart develop. The early year rally which was halted at the previous top level was accompanied by a very weak showing from the momentum indicator. The strength of that advance was showing to be pretty weak resulting in a negative divergence signal from the momentum indicator. In addition, the On Balance Volume (OBV) indicator suggested a lack of speculators interested in the up side. The OBV did not get back to its previous high giving us another negative divergence. Things finally fell apart in March.
I wouldn’t go through all the indications of a $ down turn but one indicator might be interesting to note. The short term moving average line (15 DMAw) dropped below the intermediate term line in March confirming an intermediate term bear move in progress. It has now crossed below the long term moving average line confirming a long term bear market in progress. Now, this indicator is not always accurate, no indicator is, but one would be very, very courageous going against the message of these moving averages.
The double top pattern is easy to spot, a top in November and another in March with a bottom in December. Everyone seems to be jumping on this pattern but it has not yet been completed. It must move below its December bottom for a double top confirmation. Once that happens it gives us a projection for the move down to the 68.0 level. That would take us below the previous low of 71 set in early 2008 and continue the slide in the $ that started in 2001 from the 121 level.
I wonder what that would mean to the price of gold? $1600 here we come?
GOLD : LONG TERM
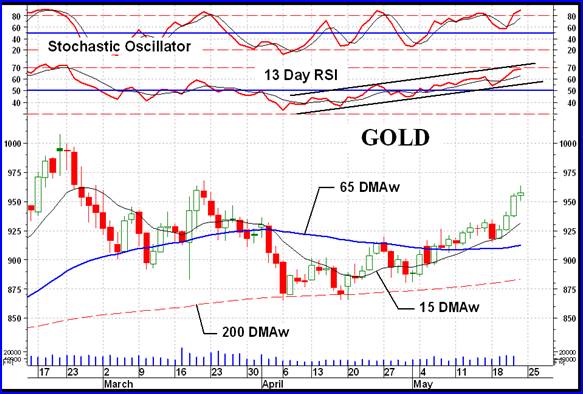
Gold just keeps on trucking on the up side. From the long term standpoint there is nothing here that would cause us to be concerned for now. The price of gold is well above its positive sloping moving average line and as confirmation of the trend, the short term moving average line remains above the long term line. The momentum indicator continues in its upward path inside its positive zone and above its positive trigger line. However, the momentum indicator is not yet showing any significant strength out of the ordinary. I would like to see it acting a little stronger than the price itself. The volume indicator has moved above its long term trigger line and the trigger has now turned to the up side. The long term rating remains BULLISH.
INTERMEDIATE TERM
On the intermediate term all seems to be rosy for a continuation of the advance. The price of gold has once more crossed above its intermediate term moving average line and the line has turned to the up side. The momentum indicator remains in its positive zone above its positive trigger line. The volume indicator continues to move higher above its intermediate term positive trigger line. AND the short term moving average has crossed above the intermediate term moving average and is moving ever higher. What more is there to say, the intermediate term rating remains BULLISH.
As an aside, I hope readers are not taking the rating as meaning that I think that the price of gold will CONTINUE to rise over the intermediate term. The rating suggests ONLY that AT THIS POINT IN TIME the intermediate term indicators are positive in their message. Those with an intermediate term investment or speculative horizon would remain in the market under such rating. The rating could change next week or the week after depending upon market action during that time. Should the rating change it only means that at that point in time the indicators had turned to the negative. Those with an intermediate term focus would then consider removing themselves from the market until things turn back to the up side. Of course, whether an investor or speculator remains in the market or gets out is an individual decision based upon many factors, most of which cannot be know in a commentary such as this. This all is also applicable to the short and long term.
SHORT TERM
If one were looking for any sign that the trend may accelerate then the action of the past few days might be to one’s benefit. It seemed to accelerate on the up side. However, one should not jump to immediate conclusions. Just go with the trend in motion and forget trying to guess ahead of time where it will all end. You can assume where it will go but DO NOT make that assumption your investment criteria to live and die by. Markets have a way of frustrating most investors most of the time.
The short term prognosis is easy, as was the other time periods. Gold price remains above its positive sloping moving average line. This trend has been confirmed back on 23 April when the very short term moving average line crossed above the short term line. It has remained above the short term line ever since and is continuing to head higher. The short term momentum indicator has been tracking nicely within an upward sloping channel and is getting close to entering its overbought zone (although it’s not quite there yet). The daily volume activity is also starting to perk up on the up side. What more can one say, the short term rating must remain BULLISH.
From the very short term standpoint, to gauge the immediate direction of least resistance, the Stochastic Oscillator has already entered its overbought zone and may be getting ready to top out. We should not be surprised if the trend takes a rest just about here. The price action on Friday was somewhat disappointing but that may be more the result of speculators in the U.S. getting ready for their Independence Day. Other than a “feel” that the trend is ready for a rest one must remain positive with the trend of least resistance still to the up side.
SILVER
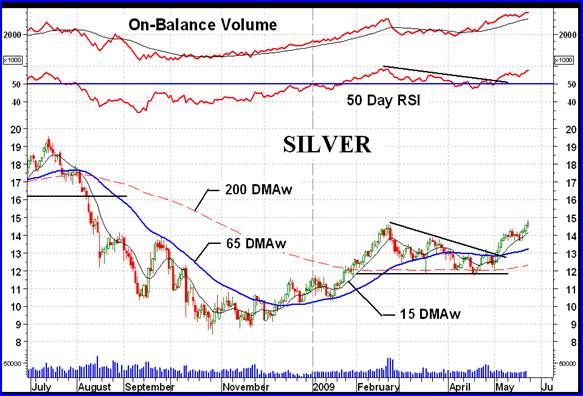
The price of silver has just moved into new recovery high territory. The momentum indicator HAS NOT yet confirmed the move but the volume indicator has. The volume indicator is moving nicely into new all time highs. The On-Balance Volume (OBV) is probably the most popular indicator for showing the volume trend. It was developed by Joseph Granville back in the early 1960’s. Although Granville DID NOT approve of the use of moving averages with his indicator I find the moving average as a trigger line to gauge if the trend of the indicator is positive or negative quite beneficial. Here I show my intermediate term trigger line with the OBV. As we see, the OBV turned positive a few weeks BEFORE the price or the momentum did. This is a good example of the speculators acting on the up side ahead of the price finally taking off. We have the same break-out in the gold chart except not as pronounced. Gold OBV has moved above its March high but not yet above its Feb high. As far as the metals are concerned, going to the Non-Edibles Futures Indices Table silver is the number one non-edible future for the short and long term while gold is number 3 and 4 respectfully.
A few months back I had mentioned the “saucer” reversal pattern and the fact that the price was going into a “handle” period. Well, the saucer must have been a heavy one as it took a while for the handle to be completed but it seems to be complete now. We could be now looking at further upside activity here.
If you are into the stocks, silver stocks may be your better bet than gold stocks, although there is always great moves in either stock category.
PRECIOUS METAL STOCKS
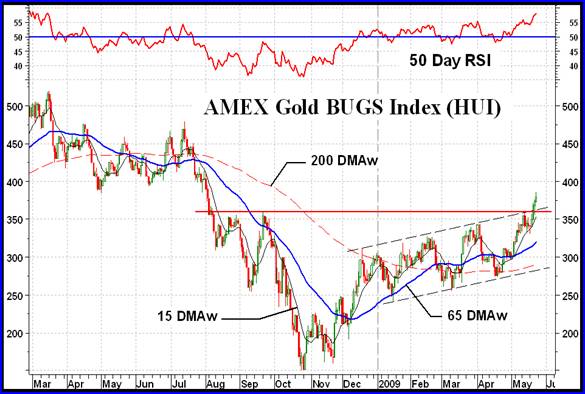
Probably the second most popular of the North American gold Indices, the HUI is now an NYSE Acra Index. The “BUGS” in its name does not refer to gold enthusiasts but to “Basket of Unhedged Gold Stocks”.
I usually see upward sloping channels broken on the down side but here we have an example of an upside break. That might suggest a strong market and much higher levels ahead. The Index has now also broken into new recovery highs, above a 10 month resistance level. All indicators are on the GO side. The short term moving average line is comfortably above its intermediate term line but as this Index shows, we could get whip-sawed by this moving average concept. We’ve been whip-sawed twice recently so any indicator concept must be watched for times when it turns on you.
Since reaching its bottom this Index has now climbed some 150%. Not so bad. However, one must remember that the Index is calculated based upon more weight given to some stocks in the Index and less weight to others. Out of the 15 present Index stocks, three provide about 40% of the Index value, double the amount their numbers would suggest.
The average price advance of the Merv’s Gold & Silver 160 Index, my universe of 160 stocks, gives just about the same % move as the HUI shows. However, looking at the movers over the past 200 days (long term movers) the top five stocks have advanced an average of about 400% (the top stock has moved 612%). Boy, you can see why there are so many speculators jumping on the gold and silver stocks. I wonder what the average price increase was for the top 5 DOW or S&P/TSX 60 Index stocks? Probably not anywhere near as interesting as the gold and silver stocks.
Merv’s Precious Metals Indices Table
I have not been able to solve a new problem of obtaining the FTSE Indices data promptly as I was able to do before. My previous source seems to have cut off providing the data or else has hidden it away in their web site and making it more difficult to get. The FTSE Indices are therefore based upon the week from Thursday to Thursday and do not represent Friday’s action. This will continue until I can find another source for same day FTSE Index data. If any readers know of a source that provides same day FTSE Gold Indices data I would be very appreciative for this information. I can be reached at mervburak@gmail.com.
Well, let’s call it another week.
By Merv Burak, CMT
Hudson Aero/Systems Inc.
Technical Information Group
for Merv's Precious Metals Central
For DAILY Uranium stock commentary and WEEKLY Uranium market update check out my new Technically Uranium with Merv blog at http://techuranium.blogspot.com .
During the day Merv practices his engineering profession as a Consulting Aerospace Engineer. Once the sun goes down and night descends upon the earth Merv dons his other hat as a Chartered Market Technician ( CMT ) and tries to decipher what's going on in the securities markets. As an underground surveyor in the gold mines of Canada 's Northwest Territories in his youth, Merv has a soft spot for the gold industry and has developed several Gold Indices reflecting different aspects of the industry. As a basically lazy individual Merv's driving focus is to KEEP IT SIMPLE .
To find out more about Merv's various Gold Indices and component stocks, please visit http://preciousmetalscentral.com . There you will find samples of the Indices and their component stocks plus other publications of interest to gold investors.
Before you invest, Always check your market timing with a Qualified Professional Market Technician
Merv Burak Archive |
© 2005-2022 http://www.MarketOracle.co.uk - The Market Oracle is a FREE Daily Financial Markets Analysis & Forecasting online publication.