Stock Market Investing Profits Map For The Next 6 Months!
Stock-Markets / Investing 2009 Jun 01, 2009 - 01:20 PM GMTBy: Uncommon_Wisdom
 Larry Edelson writes: Every so often it pays to take a few steps back … look at the charts from a longer-term point of view … and put the markets into perspective.
This is especially true today with so much confusion in the markets … so much misinformation in the news … so many threats to your wealth … and so much background noise and distractions.
But when you step back and look at the big picture, you can clearly see that major trends do NOT change overnight.
In a few minutes, I’ll show you my market roadmaps of the Dow Industrials, the dollar, and gold.
But before I do that, let me give you the conclusions I‘ve drawn from the latest long-term review I’ve done of my research, economic models, and trading cycles.
First and foremost, the mortgage, debt, and real estate crises in the United States are not over — not by a long shot. Neither is the destruction occurring in commercial real estate … the automobile industry … and small and large businesses alike all over the country.
Second, this also means the Fed will continue to …
![]() Pump even more fiat money into the economy like there’s no tomorrow to prevent a financial meltdown
Pump even more fiat money into the economy like there’s no tomorrow to prevent a financial meltdown
![]() Purchase more of the U.S. Treasury’s debt, in one giant shell game that will forever change the value of your money, devaluing it in the greatest re-inflation campaign of all time
Purchase more of the U.S. Treasury’s debt, in one giant shell game that will forever change the value of your money, devaluing it in the greatest re-inflation campaign of all time
![]() Keep short-term interest rates absurdly low, with savers bearing the brunt of its policies
Keep short-term interest rates absurdly low, with savers bearing the brunt of its policies
The end result …
![]() A dollar that will remain in a long-term bear market, clearly set to lose much more of its purchasing power in the months and years ahead
A dollar that will remain in a long-term bear market, clearly set to lose much more of its purchasing power in the months and years ahead
![]() An ongoing collapse in U.S. Treasury bond prices, despite the Fed’s purchases of U.S. Treasury bonds, and as the entire world awakens to the fact that the U.S. government is bankrupt
An ongoing collapse in U.S. Treasury bond prices, despite the Fed’s purchases of U.S. Treasury bonds, and as the entire world awakens to the fact that the U.S. government is bankrupt
![]() A continued slide into a black hole for the U.S. economy
A continued slide into a black hole for the U.S. economy
All this, while China, India and other Asian countries continue to barrel ahead.
But if you think any of the above means there’s no money to be made in the markets, think again. Just take a look at how the positions I’ve previously suggested in this column are faring …
Of the 16 suggestions I’ve made, 15 are winners, with open gains as high as 38.27 percent — in as little as eight weeks.
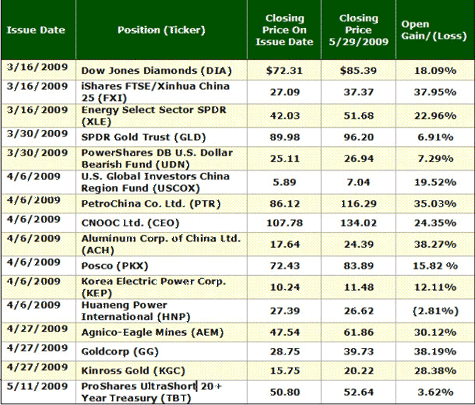
What’s more, based on what I’m seeing, I expect even more gains in the weeks and months ahead.
My Profits Roadmap For The Next Six Months …
Before I get to the specifics, there’s a few things to keep in mind …
First, wild swings will continue to dominate almost all markets, confusing investors and professional traders alike.
Consequently, those who don’t keep the big picture in focus will suffer big losses. But for those who do, big gains are on the horizon.
Second, all major intermediate-term trends remain intact. Higher for stocks and natural resources, sharply lower for the U.S. dollar and U.S. Treasury bonds.
Third, re-inflation attempts by the Fed will continue to take hold.
Fourth, Asian markets are poised to outperform U.S. markets.
Now, let’s look at the charts, so you can see for yourself what I’m talking about …
The Dow: Notice how the Dow has thrust above an important downtrend line on the weekly chart.
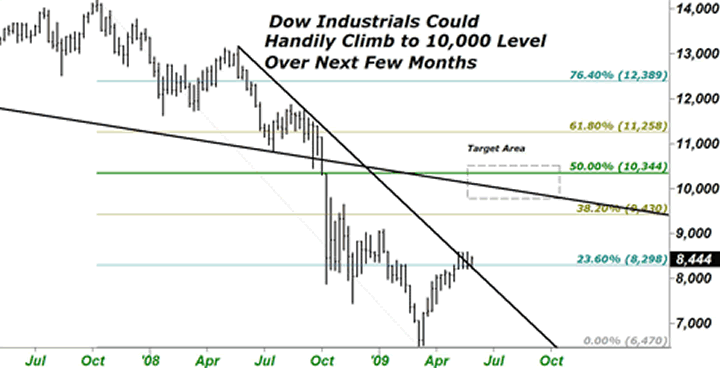
This is a significant development. While it does not mean the Dow has bottomed, it does indicate that it has certainly stabilized.
 |
Moreover, it would be perfectly normal for the Dow to continue to rally as high as the 50 percent retracement level shown on the chart, regaining half of what it’s lost from its peak. That stands at the 10,344 level.
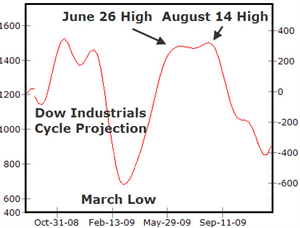
Additionally, in this second chart, my cycle studies show the Dow rallying into the end of June, then pulling back a tad, and rallying again into mid-August, where I would expect 10,344 to be reached.
Bottom line for the Dow Industrials: I expect the rally in stocks to continue higher, albeit with pullbacks along the way.
The U.S. Dollar: The dollar is a key driver of many markets.
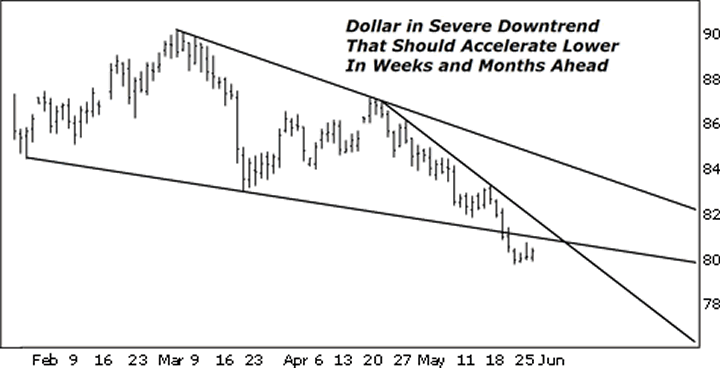
Notice how weak the dollar is on this chart.
 After a brief rally in April, the dollar has collapsed again and now lies within striking distance of its record low. The downtrend is solid, sharp, and almost relentless with no major support nearby, other than the record low at 70.698 on the index.
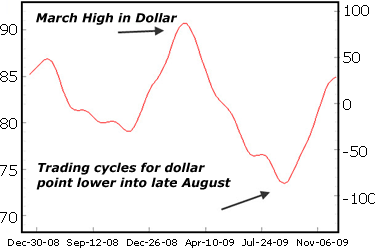
Plus, this cycle chart of the dollar confirms the chart action. It shows the dollar trending lower into late August, early September, before the downtrend gets any relief.
Bottom line for the dollar: It’s in trouble. This supports my fundamental view that the Fed not only is printing money like crazy, but will continue to do so. And, despite what the Fed may say in public, it actually wants a weaker dollar to help re-ignite asset inflation.
Gold: The yellow metal is in an extraordinarily bullish position, preparing to blast off to well over $1,000 an ounce.
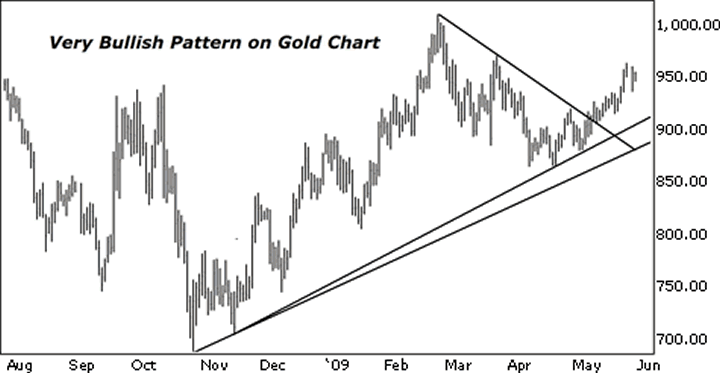
Take a look at the chart. Notice gold’s strong uptrend, supported by two rising uptrend lines.
Also, look at how gold has now thrust up through the downtrend line from its most recent high back in March. A very bullish picture indeed!
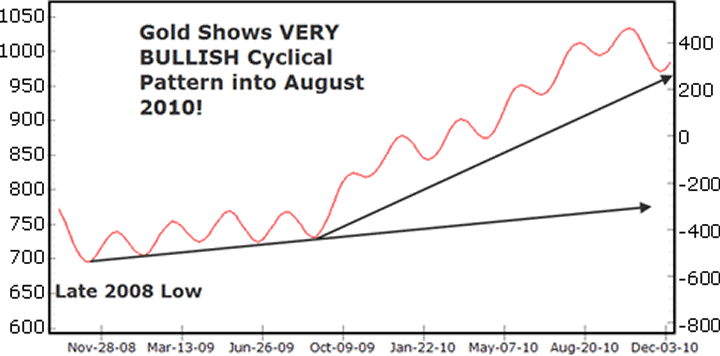
Even more bullish: The cycle projections for gold. Look at how my cycle projections nailed gold’s late 2008 low at just under $700. It then pointed to a choppy but rising trend through the first half of this year, which is exactly the action we saw, with gold rising more than $50 last week alone.
Now take a look at the October period for this year, and see how the bullish cycle patterns literally take off to the upside, rising into the fall of 2010!
These projections in gold are entirely in keeping with the underlying fundamentals, which show …
1. A deteriorating economy
2. Massive re-inflation efforts by the Fed
3. A collapsing dollar
Bottom line for gold: It’s one of the strongest assets there is, as I’ve been telling you all along. I expect my target of $2,250 gold to be hit by August 2010, and possibly even sooner.
Bottom line for YOU …
First, if you don’t already own any of the shares mentioned previously, it’s not too late.
I would seriously consider buying the Dow Jones Diamonds (DIA) … the iShares FTSE/Xinhua China 25 (FXI) … and the Energy Select Sector SPDR (XLE).
For those and any other positions you buy, place a protective sell stop at no more than 10 percent below your entry price to help reduce risk.
Second, you must own gold. That should be a no-brainer. One of the best ways: The SPDR Gold Trust (GLD), the most liquid gold exchange traded fund out there.
For more precise buy-and-sell signals and other ways to trade gold, including mining shares and more, be sure to see my Real Wealth Report.
Third, continue to steer clear of long-term U.S. Treasury bonds. They are a disaster in the making. There is nothing safe about them right now.
Fourth, stash your safe-keeping money in short-term Treasury bills or the equivalent Treasury-bill only money market fund.
Fifth, to make oodles of money, don’t be afraid of the markets and don’t confuse the economy with the markets. Sometimes markets make major moves that are a complete paradox with the underlying fundamentals.
Just like we’re seeing now. The economy is still sinking, yet stocks are rallying and getting set to rally even more.
Lastly, stay tuned!
Best wishes,
Larry
P.S. Be sure and join my Real Wealth Report as we make oodles of money in these markets. It’s just $99 a year for 12 monthly issues, 24/7 website access, all flash alerts and all recommendations!
This investment news is brought to you by Uncommon Wisdom. Uncommon Wisdom is a free daily investment newsletter from Weiss Research analysts offering the latest investing news and financial insights for the stock market, precious metals, natural resources, Asian and South American markets. From time to time, the authors of Uncommon Wisdom also cover other topics they feel can contribute to making you healthy, wealthy and wise. To view archives or subscribe, visit http://www.uncommonwisdomdaily.com.
Uncommon Wisdom Archive |
© 2005-2022 http://www.MarketOracle.co.uk - The Market Oracle is a FREE Daily Financial Markets Analysis & Forecasting online publication.


