


Gold and Silver Analysis - Precious Points: No Lack of Support
Commodities / Gold & Silver May 28, 2007 - 12:44 AM GMTBy: Dominick
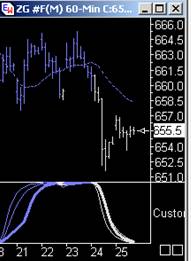
 Oroborean writes: This week saw a full cycle in the 60-min gold trend cycle chart and, as warned, the move up did not see a dramatic increase in price. This, of course became it's own warning signal. Stocks and metals both saw a pullback on Thursday that had most major indices breaking through long-standing trendlines and the 60-min gold chart racing back towards the bottom.
“TTC's proprietary 60min trend chart is looking for this move to continue, but that doesn't necessarily require a dramatic change in price… stocks could be overextended and due for a pullback, and metals probably won't provide much cover… sometimes a bounce is just a bounce.” ~ Precious Points: A Bounce is a Bounce , May 20, 2007
But, for the third time in a row, a down week for metals ended with a modest rally that puts an optimistic spin on the week ahead. So far, each rally has given way to further selling in the subsequent trading sessions. Despite the intensity of the selling last week, metals did not retreat far enough to reach the important support levels outlined in the last update. Of course, this could mean there's more downside to come in the near future, but unless it materializes and those levels are truly tested, that resilience is positive.
Remember that about two months ago, on April 1, the chart below was posted publicly in this update. At the time the fundamental outlook for precious metals was excellent, but technical obstacles suggested an unfettered, parabolic run like the previous year's was unlikely. The red lines above $700 represented the target area for the then current move, the anticipated higher highs, and the area from which the direction of the next move would be decided.
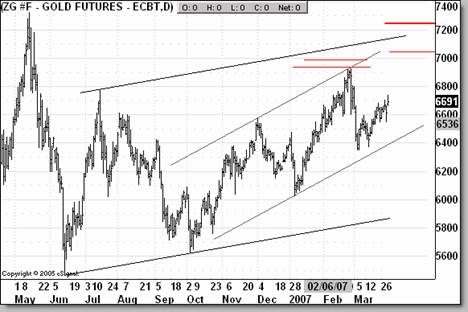
(chart by Dominick)
As gold approached the target range, this update became increasingly skeptical of a successful attempt at the May 2006 high. On April 15, as gold approached the target range, in an update titled “Got Discipline?” this update warned that “metals traders should be aware of the risk to their positions over the next several months”, and that a “significant correction” would ensue if metals failed to take out their May 2006 levels. Shortly afterward, metals reached the center of the target area and did suffer that correction.
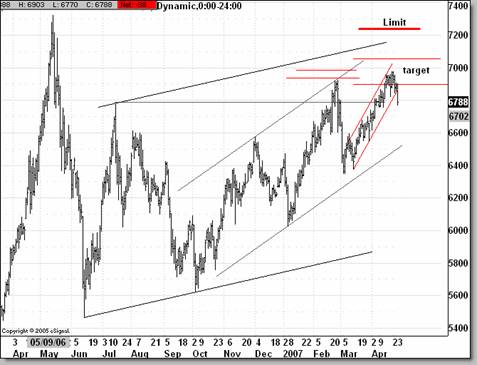
(chart by Dominick)
Since late April the overall economic outlook has deteriorated somewhat and the apparent decline in measured inflation has contributed to sluggishness in metals. Over the past four weeks this update has been focused on the Fed's open market activities, particularly the decline in the total amount of “sloshing” repo funds, as a rough indicator of the demand for money, since actual M2 figures are delayed by a week. As economic outlook seemed to brighten with resilient (though dubious) job creation and improving (though dubious) new home sales, the streak was finally broken, albeit modestly, with a net add of $3 billion last week.
Whether or not it proves to be the case that the economy has moved through the worst part of its decelerating growth, and there's no shortage of reasons to think it has not, next week will offer plenty of new information to ponder in regards to the economy and the Fed. The most obviously relevant for metals are Thursday's PCE and unemployment data, but reports on consumer confidence, auto sales, and GDP, as well as the Fed minutes, Chicago PMI and the ISM results will color the overall economic outlook and likely move the metals markets.
A growing concern for some was encapsulated last week in the televised appearance of Richmond Fed President Jeffrey Lacker, whose optimism for the economy leads him to conclude inflation expectations will flare again in the second half of this year. Though he's no longer a voting member of the current FOMC, bond traders have seemed to agree with his logic and have pushed yields higher, over 5% in the case of the 30-year bond.
High interest rates are typically a negative for metals, which don't pay regular dividends or interest, but this update has repeatedly emphasized that creeping bond yields and incremental rate hikes indicate a bullish, liquid environment for metals – so long as rates don't go too far, too fast. With the market all but giving up on rate cut relief this week, the proliferation of leveraged buyouts and junk bond issuance, and the steady surge in bank loans strong and global liquidity, give every indication that real interest rates might be too low. In fact, with M2 increasing at a 6.6% clip over the last year, some investors might be inclined to find the real return on bonds quite unattractive even at these levels.
Still, with housing continuing to be a substantial drag on GDP, the Fed is unlikely to pursue Lacker's vision of reducing aggregate production and demand through a rate hike. Lacker's vigorous attention to inflation helps the case of the metals, particularly with Thursday's PCE release, but a higher target rate from the Fed would probably be a very difficult pill for most markets, including metals, to take. Luckily, it's a dose not likely to be administered anytime soon by the Fed. The rise in bond yields, too, has in all likelihood been exaggerated by refunding and may therefore be reaching a short term peak at these levels, putting short term corrective pressure on stocks and metals, though diversification by China and other central banks is probably only beginning.
So, in a week full of economic data, the precious metals will have their work cut out for them. The chart of gold below shows violation of and a close below a six-month up trend. Consolidation here is not necessarily negative, but a breach of strong support near $640 should attract attention while a reversion to the 200-day moving average near $500 remains highly unlikely. On the other hand, two consecutive weekly closes above the 5-day moving average would reassert the up trend and suggest the start of another powerful surge.
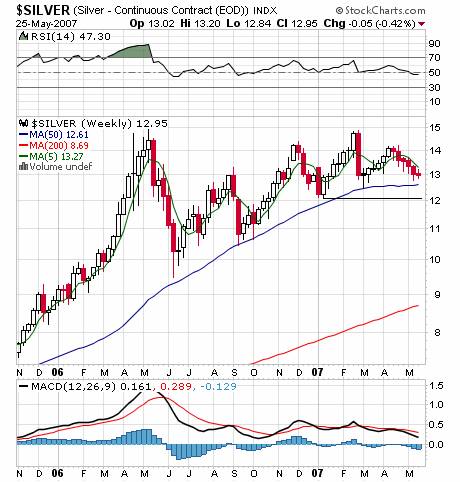
But, whereas gold has managed to stage higher highs and higher lows off its October bottom, silver's last high fell notably short. The convergence of the 5-day and 50-day moving averages on the chart below suggests an important inflection point drawing near. A move into support at the $12.45-12.60 area could feel painful, but still preserve the overall up trend, but as with gold, two consecutive weekly closes above the 5-day average will be required to confirm the return of bullish action.
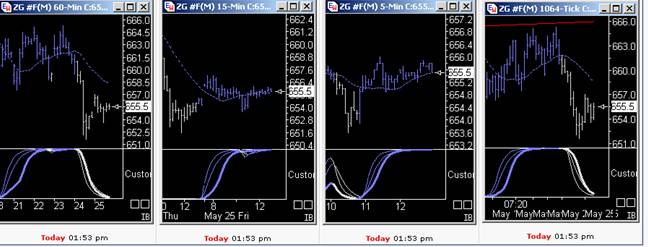
Short-term traders should note that members at TTC had the benefit of the trend cycle charts in finding the exact bottom of the last decline in gold, which was captured beautifully by the 5-min chart. With the 5- and 15-min charts now pegged at the top, all eyes remain on the 5-, which will either lift the 60- or start a fresh move lower. If Tuesday's Consumer Sentiment comes in as expected, look for the former scenario.
Finally, TTC will be raising its monthly subscription fee this summer. The increase has become inevitable due to our ongoing expansion of the website, computer and software upgrades, and the addition of services such as trend cycle charts. Current members and anyone who joins before the increase takes effect will not be subject to the new price, and will continue paying the current $50 subscription fee on a month-to-month basis. If you have been thinking of joining, this would be a great time.
by Joe Nicholson (oroborean)
This update is provided as general information and is not an investment recommendation. TTC accepts no liability whatsoever for any losses resulting from action taken based on the contents of its charts,, commentaries, or price data. Securities and commodities markets involve inherent risk and not all positions are suitable for each individual. Check with your licensed financial advisor or broker prior to taking any action.
© 2005-2022 http://www.MarketOracle.co.uk - The Market Oracle is a FREE Daily Financial Markets Analysis & Forecasting online publication.