Gold Heading Below $900 on Seasonal and Fed Driven Reduction in U.S. Dollar Liquidity
Commodities / Gold & Silver 2009 Jun 08, 2009 - 03:05 PM GMTBy: Ned_W_Schmidt
 As the investment community celebrates the first bankruptcy of General Motors, a look around the world reveals the vast financial acumen of governments. We do not have to stop with the financial irresponsibility of the Obama Regime, evident by the two trillion dollar plus deficit. We could just as well turn to the expense account scandal that may bring down the UK government. Or, we could look to the financial wizardry of California, or the high finance skills so evident in Jefferson County, Alabama. Or, we could watch in wonder as oil production collapses in Mexico and Venezuela where politicians have squandered oil revenues.
With such revealing evidence to turn to for confidence, we sometimes wonder how anyone can accept at face value the debts of these governments. Those debts being what we call fiat money. Gold bugs are not born. They are created by unbroken history of financial failures on the part of governments.
And then we turn to the U.S. Federal Reserve. Never has a government experiment been such a near complete failure. As that organization closes in on its 100th anniversary we hope that their performance will improve. With a near perfect 100 year record of getting it wrong, they would seem to have made all the mistakes possible. The next 100 years can only be better. And with that we turn to this week’s first chart.

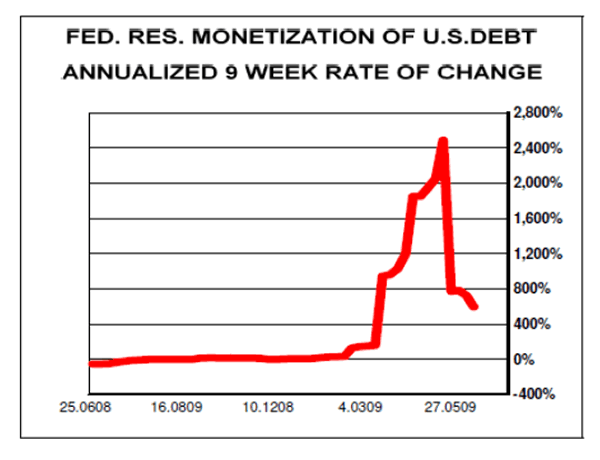
In that chart is plotted the annualized rate of debt monetization by the Federal Reserve. We used a nine-week rate of change to give it some smoothing in order to avoid the noise in much shorter term data. Longer term measures lack sufficient detail. The rate of debt monetization by the Federal Reserve, per this measure, rose to more than 2,400%, on an annualized basis. That is a “printing press” on steroids, or some kind of white powder.
In order to achieve that monetization, the Federal Reserve flooded the U.S. financial system with reserves, or liquidity. The arrival point for that liquidity into the system is the primary bond dealers. They sell bonds to the Federal Reserve, receiving liquid funds in exchange. On those liquid funds the dealers earn nothing.
Dealers, suddenly awash with liquidity earning nothing, move to find ways to remedy that situation. That liquidity ultimately flows into the financial markets as they do so. That incredible burst of liquidity served as “rocket” fuel for markets of all kinds, from stocks to Gold and Silver. Except for the bond markets in near collapse under the Obama Deficit, markets across the entire spectrum have moved upward as that liquidity was put the work.
In recent weeks, as shown in the graph, the rate of monetization has dropped dramatically. While still too high, the rate of monetization has been declining. That action, for financial markets, is the equivalent of taking one’s foot off the gas pedal. As that is done, the car slows. As the above happens in the market for liquidity, financial markets subsequently slowdown. Additionally, as less dollar liquidity is available, dollars are less freely available. That development gives the dollar some short term strength, as the supply of dollars is growing more slowly. Remember, what happens at the margin, or the second derivative, is the driver for financial markets.

Last week the first impact of this declining dollar liquidity was felt in the Gold market. $Gold peaked early in the week, and slid dramatically on Friday. Summer normally is a period of declining dollar liquidity, for whatever reason. That normal seasonality is now coming together with slowing debt monetization on the part of the Federal Reserve. Together and combined, less liquidity is now available for all markets.
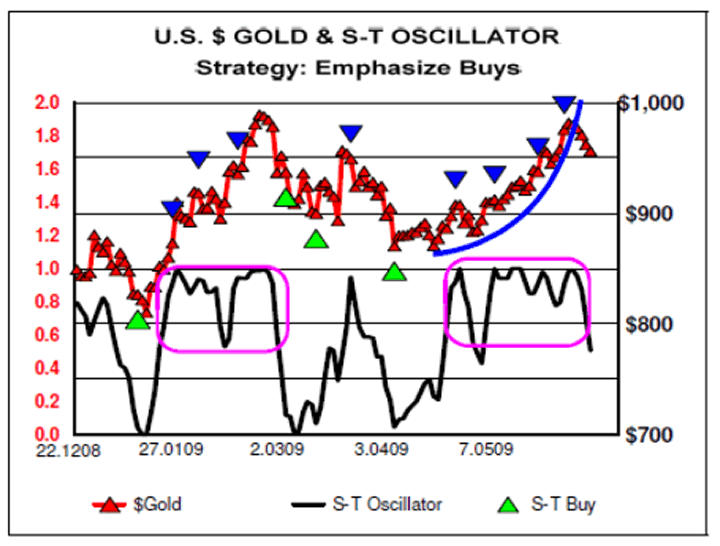
In the above chart we can observe the positive impact of that massive creation of dollar liquidity. $Gold rose from about $860 to more than $980. In doing so, $Gold moved in a mini-parabolic curve, as indicated by the blue curve in the graph. It has now moved down and through that curve. Such a move usually indicates that it will move down further. The seasonal and Federal Reserve driven reduction in dollar liquidity is now having an impact on $Gold that may send it below $900.
This development should be seen as an opportunity for $Gold investors. The lack of dollar liquidity this Summer may be providing $Gold investors the last major opportunity to buy $Gold under $1,000. Our intermediate indicator should give several timely and important buy signals during this period. As the liquidity situation turns back up in September, $Gold will move higher. As it does so it will exit the pattern in which has been trapped since March of last year. In doing so, $1,000 will become the floor and no longer the ceiling.
By implication, this development is making other currencies short-term over valued. That action depresses the price of Gold when expressed in those currencies. Those over valued currencies should be used to buy Gold. For example, investors living in Canada, the EU, and England should be buying Gold.
By Ned W Schmidt CFA, CEBS
Copyright © 2009 Ned W. Schmidt - All Rights Reserved
GOLD THOUGHTS come from Ned W. Schmidt,CFA,CEBS, publisher of The Value View Gold Report , monthly, and Trading Thoughts , weekly. To receive copies of recent reports, go to http://home.att.net/~nwschmidt/Order_Gold_GETVVGR.html
Ned W Schmidt Archive |
© 2005-2022 http://www.MarketOracle.co.uk - The Market Oracle is a FREE Daily Financial Markets Analysis & Forecasting online publication.


