


Silver’s 61.8% Fibonacci Top Is Here
Commodities / Gold & Silver 2009 Jun 09, 2009 - 06:03 PM GMTBy: Florian_Grummes

 It´s time again to update my technical perspective on silver.
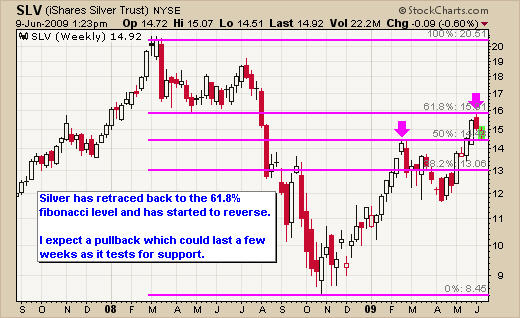
Last week the strong rally in Silver ended exactly at the 61.8% retracement from the bear market since the summer 2008 from the $21.44 low to the november low $8.40. I still find id amazing how precise markets can be at times.
Weekly Silver Trading Chart
Since hitting this important fibonacci level last week silver is down more than 8% already. Silver was quite overbought and a correction was expected. Normally corrections in gold and silver last 2-6 weeks.
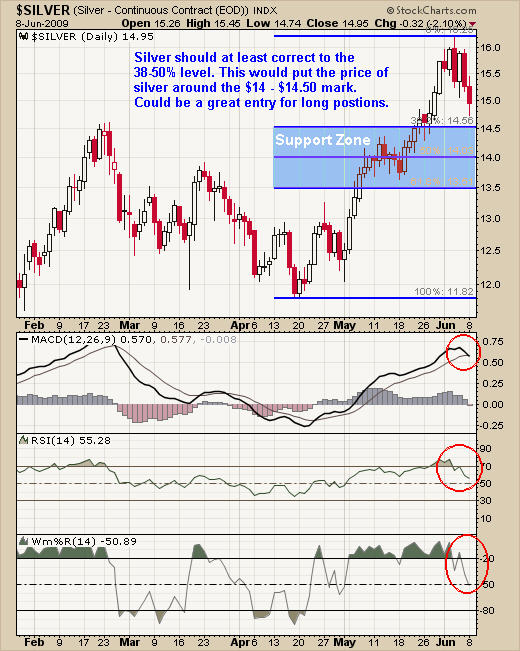
Daily Silver Trading Chart
On the daily chart you can see that the RSI has already turned down and as well MACD is creating a sell signal right now. On top the 50 and 200 Moving averages (as possible support) are still quite far away. Therefore Silver should at least retreat to the 50-61.8% retracement levels within the next couple of days and weeks.
If $13.50 does not hold on a daily basis we will know that this is not just a correction within an uptrend. In this case I expect silver to test the strong support around $11.80-$12.80.
Besides the technical picture as well seasonality definitely does not favor any long positions at the moment. “Sell in May“ seems to be the right decision again this year inspite the ongoing longterm bullmarket in precious metals.
Daily Silver Trading Chart
As well the chart of my favourite silver mining stock SILVER WHEATON clearly shows the potential for an ongoing correction.
Between $10.80 and $12.00 there is massive resistance and prices broke down with increasing volume after running on top of the bollinger band.
The 50 and 200 Day Moving Averages are far away which is plenty of room for prices to drop further !
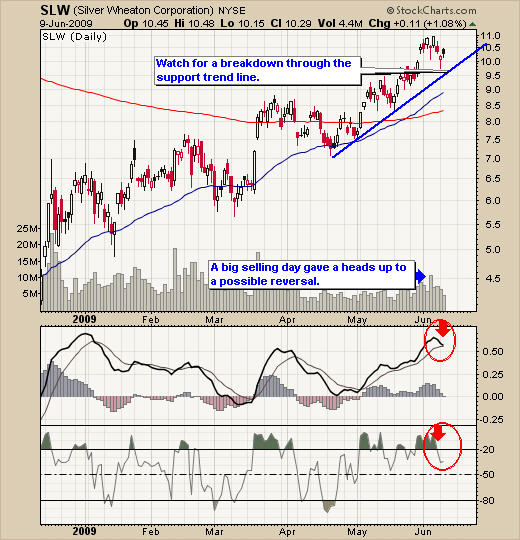
Therefore I think the chances are pretty high to see the share price for Silver Wheaton falling down into the $8.50 to $9.00 levels. Here we could find a very good setup for a reentry later this summer once the commodity market takes a breather.
You can recieve my trading analysis free each week if you like my view on the markets.
By Florian Grummes
www.TheSilverGoldSpot.com
Learn to Trade ETF's While Your Making Money Trading
© 2009 Copyright Florian Grummes - All Rights Reserved
Disclaimer: The above is a matter of opinion provided for general information purposes only and is not intended as investment advice. Information and analysis above are derived from sources and utilising methods believed to be reliable, but we cannot accept responsibility for any losses you may incur as a result of this analysis. Individuals should consult with their personal financial advisors.
© 2005-2022 http://www.MarketOracle.co.uk - The Market Oracle is a FREE Daily Financial Markets Analysis & Forecasting online publication.