


Stock Market Range Bound, Waiting for Something to Happen
Stock-Markets / Stock Index Trading Jun 14, 2009 - 12:50 PM GMTBy: Jack_Steiman

 I imagine it could but it would have to be a very unique situation to be more boring than this market is right here. I mean, it's not as if we're trading in a large range. The S&P 500 range is 923-950. Neither one wants to break. The daily charts are technically set up to fall with the highly compressed MACD's and the nasty divergences across the board. There is no theoretical timetable for when a market should fall based on these conditions, but the set up is there. What we're seeing, unfortunately, is a market that is teasing both sides near term. We get gap after gap and each one is met with real hope by whomever is fortunate to have it working in their favor.
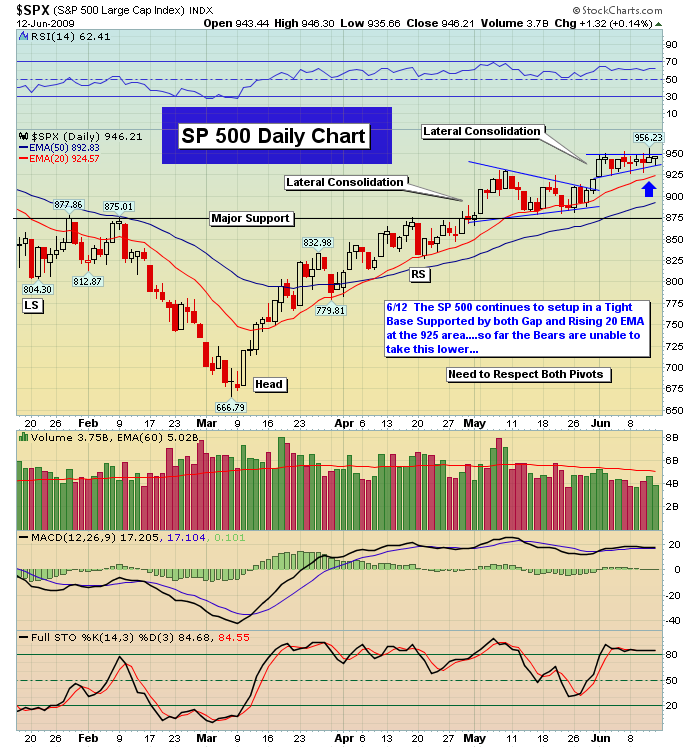
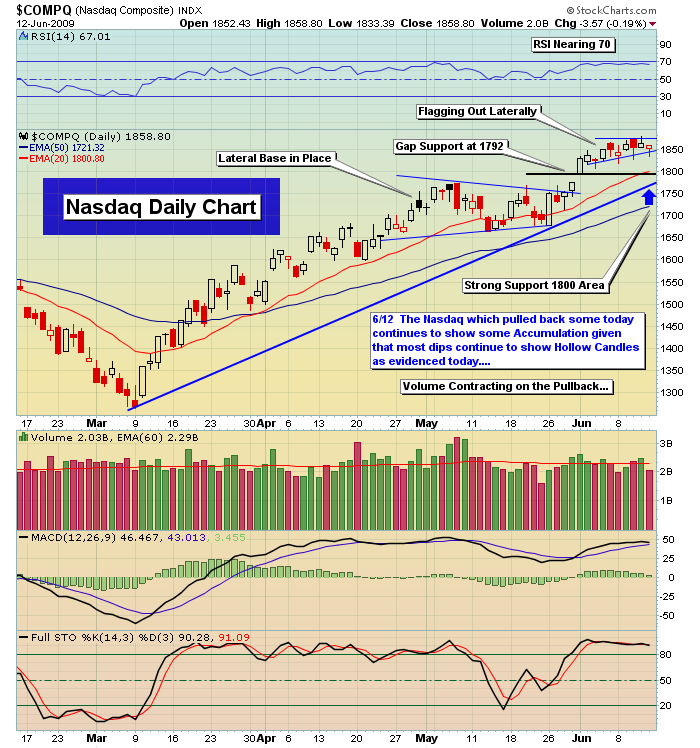
The hope quickly gets turned to disappointment when the market reverses course shortly after that gap takes place. There's no gap and run. Rather, we get gap and churn, and the churn turns in to reversal. The reversal doesn't blast either. It simply reverses and then sits still either below 943 or above 923. Talk about market boredom. This is taking place day after day after day. It seems we get a decent gap every day and every day it fails. Tails are the way. It's as if we close on a doji every day. Where we open is where we close. Within a few points. No one, and I mean no one, has any control. The gap at Nas 1910 may be a target the bulls want before the buying finally ends.
So hard to say or know for sure. Every day the bulls are able to keep this bull flag pattern off the latest move up in place is another day of adding solidity to the rally and allowing the market to have hope for moving higher still before some larger selling kicks in. It's like putting another nail in the box to keep it secure against criminals. Nothing bearish in place yet from strictly a price perspective. We are still easily holding key support and until that goes, the bears can talk about gloom and doom all they want but they have nothing for which to back up that talk.
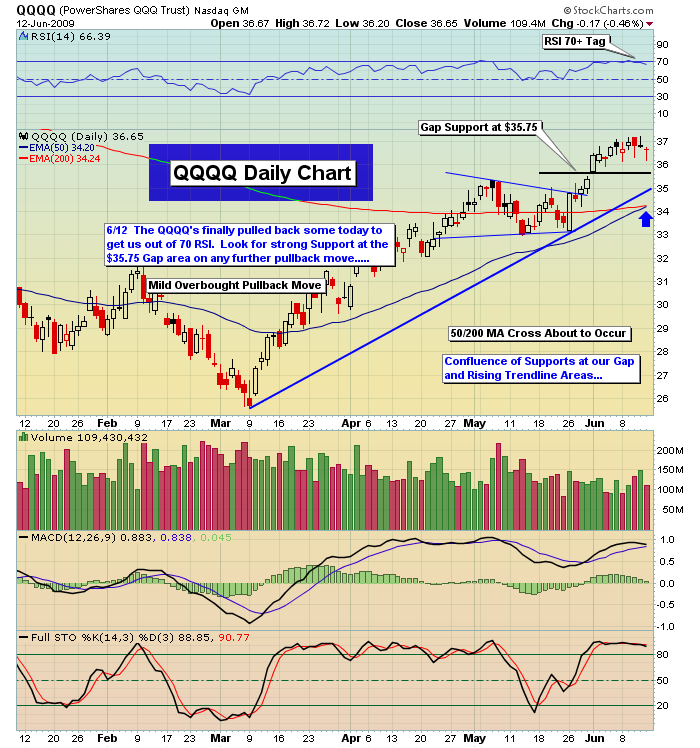
Back to the VIX. A close in the 28's Friday and that has to be considered a bullish indicator for this market. It has made many attempts to crack back through 30 and although it is successful for a few moments, it has been unable to hold above and thus drifts lower still. The bears don't have much of a chance to take this market down and keep it down with a VIX reading this low. The lower it drifts away from 30 and the lnoger it does so, the harder it's going to be for the bears to make the move down for the market. The VIX will eventually start to move lower and the bears will have to endure more pain as the market goes higher, overbought and negative divergences aside. Markets can fight through bad divergences form time to time and we know they can stay overbought. Even though things aren't set up great for the bulls, it doesn't mean this lateral consolidation won't take care of those problems over time and then bears are in big trouble.
Friday was typical of what's been going on with this market and why the bears aren't getting any satisfaction. When the market sells hard as it did on Friday in one particular area of the market, the money is rotating around to other sectors instead of just leaving the market completely. On Friday we saw money come out of the big tech Nasdaq stocks, which has in the past meant that the whole market was in trouble. Not Friday. The money went in to banks and just about everywhere else. As long as money is rotating and not leaving, that has to be considered a bullish sign. We had a good week swing-trading this market in Dick's Sporting (DK), Deere (DE), and Potash (POT).
Again, nothing is truly bullish until we rid ourselves of this SPX 943 level by clearing it with force, but you have to like the ability of the market to find a home for the money in there already instead of it just leaving, which would allow the SPX to finally break the 923 gap support area. In addition, this market is acting scared and what I mean by that is that those who have missed this rally are scared to miss more, so on any selling those folks are coming in to buy that weakness which also holds things up. If this trend continues it'll be near impossible for the bears to break things down, but we'll know soon enough, as again 923-943 is still the game. Tails I win and tails I lose for now.
The market finished strong on Friday. Gap down reversal and then good finish. Hard to find any fault with the late day action. It seems the market will test higher again and 943 is right there for the taking if the bulls want it bad enough. The most important thing being the bears to this point have not been able to move the SPX far from that 943 pivot. Technically I can't say it makes much sense but never fight the tape. Never fight price action, thus it does seem we will trend higher still. You can't get aggressive because the technicals that aren't very bullish can kick in at any time. There's a major gap at 1910 Nasdaq and maybe that's what this market wants. Impossible to be very bullish here but remember that the trend is up until proven otherwise. One day at a time and going along lightly here is the way. Plays will go out as they set up.
Peace,
By Jack Steiman
Jack Steiman is author of SwingTradeOnline.com ( www.swingtradeonline.com ). Former columnist for TheStreet.com, Jack is renowned for calling major shifts in the market, including the market bottom in mid-2002 and the market top in October 2007.
Sign up for a Free 30-Day Trial to SwingTradeOnline.com!
© 2009 SwingTradeOnline.com
Mr. Steiman's commentaries and index analysis represent his own opinions and should not be relied upon for purposes of effecting securities transactions or other investing strategies, nor should they be construed as an offer or solicitation of an offer to sell or buy any security. You should not interpret Mr. Steiman's opinions as constituting investment advice. Trades mentioned on the site are hypothetical, not actual, positions.
Jack Steiman Archive |
© 2005-2022 http://www.MarketOracle.co.uk - The Market Oracle is a FREE Daily Financial Markets Analysis & Forecasting online publication.