


Stock Market Dumb Money Indicator Giving Way to New Extremes
Stock-Markets / Stock Market Sentiment Jun 14, 2009 - 01:15 PM GMTBy: Guy_Lerner

 Investor sentiment continues on the same path as the two previous weeks as the "Dumb Money" indicator is moving to new bullish extremes. Typically, this is a bearish signal.
The "Dumb Money" indicator is shown in figure 1. The "Dumb Money" indicator looks for extremes in the data from 4 different groups of investors who historically have been wrong on the market: 1) Investor Intelligence; 2) Market Vane; 3) American Association of Individual Investors; and 4) the put call ratio.
Figure 1. "Dumb Money"/ weekly
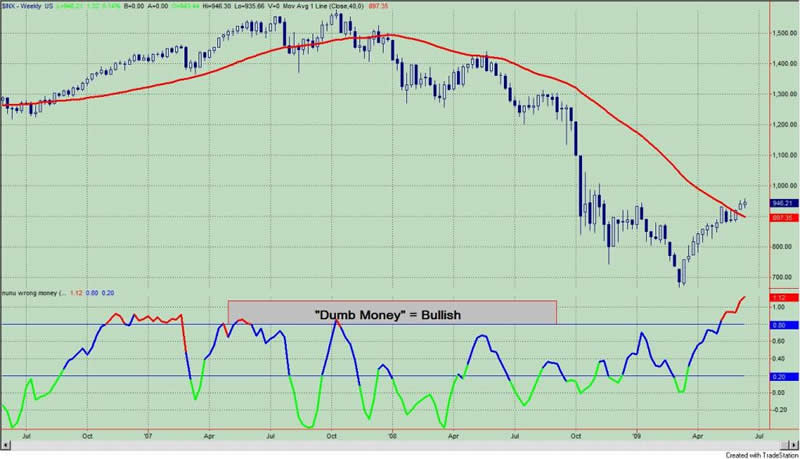
Going back to early March, 2009, the "optimal" time to buy into the market was when the S&P500 closed at 756.55 on March 13, 2009. The "optimal" time to sell was at the close April 17, 2009 with the S&P500 at 869.60. This represents a gain of 15% gain over 5 weeks or 3% per week. This is annualized to a 156% gain, and this is what one would expect at the bottom of the price cycle when the trend changes from down to up. We get an acceleration of prices higher.
From our "optimal" sell signal to this past Friday's close, the S&P500 has gained 9% over 8 weeks or 1.13% per week. This is annualized to a 59% gain, which isn't too shabby but certainly less than the move from the "optimal" buy to the "optimal" sell signal. As an aside, "optimal" doesn't mean best. "Optimal" assumes all occurrences over the length of the observable data. Could the "sell" signal have been better timed? Yes, but over the past years the "optimal" time to get out of the market and protect profits was the "optimal" sell signal. We should note that the "Dumb Money" indicator had yet to move to a bullish extreme, and we were basing our signals on prior bear market experiences.
Then on May 8, 2009, the "Dumb Money" moved into the extreme bullish zone, and this is a bear signal. On May 8, 2009, the S&P500 closed at 929.23. Since that time the S&P500 has gained 1.8% over 5 weeks or 0.36% per week. This is annualized to a 18.72% gain. Once again, this isn't too shabby, but clearly much less than the move off the bottom or from our initial "optimal" sell signal.
Yet, with the "dumb money" now bullish to an extreme, this is the part of the price cycle that appears to be attracting the most attention and most acceptance from investors. Yet, this is the part of the price cycle where the markets haven't gone anywhere. It does seem kind of odd -doesn't it? The time to have been bullish was when investors were fearful.
To embrace higher prices with sentiment so extremely bullish, you must embrace the notion that we are in a new bull market. You must embrace the notion that higher oil and higher interest rates don't matter. You must embrace the notion that second derivative growth will lead to real, sustainable growth. You must embrace the notion that our housing and commercial real estate troubles are all behind us. You must embrace the notion that a PE of 150 on the S&P500 doesn't matter. You must embrace the notion that we can have an economic recovery without any meaningful change in unemployment. And we can go on and on and on....
I have picked my poison. It is a monthly close over the simple 10 month moving average on the S&P500. Once this occurs, I will add equity exposure (that is adjusted for the inherent risk of the asset (equities) and adjusted for the other assets in my portfolio). Personally, I don't like it, and this is at odds with my own analysis that leads me to state that this is not the proper launching pad for a new bull market in equities. But then again, the market cares little what I think or do. Nonetheless, this is how I am choosing to play it. The Faber strategy, which I discussed last week, is a strategy that helps me manage money and manage risk. It is not a "call" on the markets.
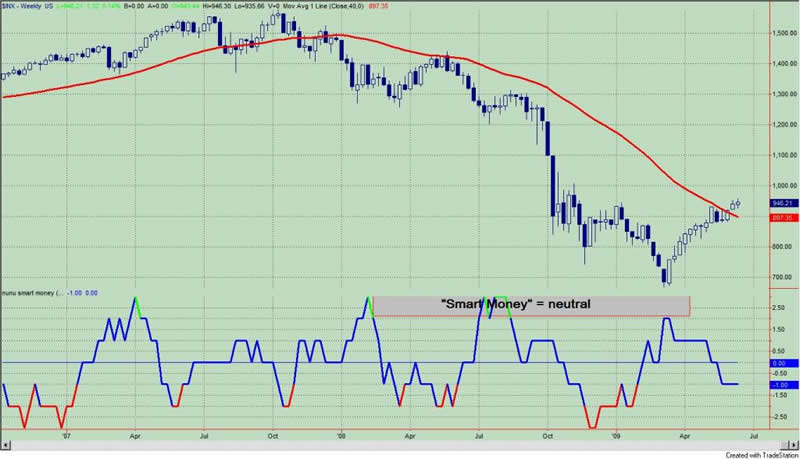
For the record, the "Smart Money" indicator is shown in figure 2. The "smart money" indicator is a composite of the following data: 1) public to specialist short ratio; 2) specialist short to total short ratio; 3) SP100 option traders.
Figure 2. "Smart Money"/ weekly
By Guy Lerner
http://thetechnicaltakedotcom.blogspot.com/
Guy M. Lerner, MD is the founder of ARL Advisers, LLC and managing partner of ARL Investment Partners, L.P. Dr. Lerner utilizes a research driven approach to determine those factors which lead to sustainable moves in the markets. He has developed many proprietary tools and trading models in his quest to outperform. Over the past four years, Lerner has shared his innovative approach with the readers of RealMoney.com and TheStreet.com as a featured columnist. He has been a regular guest on the Money Man Radio Show, DEX-TV, routinely published in the some of the most widely-read financial publications and has been a marquee speaker at financial seminars around the world.
© 2009 Copyright Guy Lerner - All Rights Reserved
Disclaimer: The above is a matter of opinion provided for general information purposes only and is not intended as investment advice. Information and analysis above are derived from sources and utilising methods believed to be reliable, but we cannot accept responsibility for any losses you may incur as a result of this analysis. Individuals should consult with their personal financial advisors.
Guy Lerner Archive |
© 2005-2022 http://www.MarketOracle.co.uk - The Market Oracle is a FREE Daily Financial Markets Analysis & Forecasting online publication.