


Trading Gold with the Gold Direction Indicator
Commodities / Gold & Silver 2009 Jun 19, 2009 - 11:20 AM GMTBy: Peter_Degraaf

 In my last article, posted on May 13th, I drew your attention to the HUI index. The article was titled: “All eyes are on Huey”. The article pointed out that the HUI index was breaking out at 350. As it turned out Huey rose to 400, an increase of 14%. At that point I alerted my subscribers to take partial profits as it appeared that the index was going to test the breakout. My subscribers saw me take some money off the table, as I e-mailed the trading details the same day.
The Gold Direction Indicator had risen to 87%.
The pullback has now taken the HUI index below the original breakout point which is not unusual. Pendulums have a way of ‘over-swinging’.
Today the GDI is at 18%, having risen up from 6% on June 11th and is providing us with a buy signal. This buy signal could be effective today, or it may take a few days for gold to rise in response.
The Hulbert HGNSI (Gold bullishness index) stands at 10.2% compared to 56.8% in May-June, just before the sell-off. This is a contrarian buy signal.
The price of gold often bottoms in early July and then meanders along, slow but steady, and after Labor Day gold takes out the top that is set in the spring. This is based on 35 years of historical data. This year, due to the massive Federal budget deficits, the bottom could come sooner, and the rate of increase could very well exceed historical rates of increase.
Featured is the daily gold chart. The uptrend channel is well defined and the pullback has reached our target at 926. Barring some unforeseen event, the expectation is for gold to break out at the blue arrow and turn the trend bullish again.
The supporting indicators are near support levels. The 50 day moving average is in positive alignment to the 200DMA, and both are rising. This is the sign of a bull market in full gallop. The rate of increase of the blue channel is 3% per month.
One of the free features on my website is ‘long-term charts’. It is updated on a regular basis.
Featured is the weekly gold chart. The arrows point to the 7 – 8 week gold cycle. The last two were ‘long and short’, but together they make 14. We are now in week #8, and while we cannot be sure if this is the bottom, all that is now required is for gold to close above 940 on Friday June 19th, in order for the cycle bottom to be confirmed.
The supporting indicators are at levels of support.
Featured is the index that compares the price of gold to the S&P 500 index. Price is finding support at the 1.00 level and a breakout at the blue arrow turns the trend (as compared to stocks), bullish again. Recent similar set-ups have resolved in favor of gold (green arrows). The supporting indicators are mixed, but will both turn positive upon a breakout at the blue arrow. The 50D is in positive alignment to the 200D and the latter is rising convincingly.
Featured is the daily silver chart. Price became overbought at 16.00 and the target for a pullback was at 14.00 (a 50% correction). The supporting indicators are at support levels. The 200DMA is turning up for the first time since August 2008! The expectation is for silver to rise back up to the blue arrow, spend a few days consolidating there, then break out, thereby turning bullish again.
Historically, based on over 40 years of data, silver almost always bottoms in June, tops out in July, bottoms again in August and after Labor Day silver day starts the annual Christmas rally.
Featured is the long bond yield chart. Since January long-term rates have been rising. The uptrend channel is well defined. The RSI has remained above ‘50’ for the entire rally. The 50D is in positive alignment to the 200D (green arrow). This trend is going to cause bond holders to sell bonds and look for a better investment (gold?).
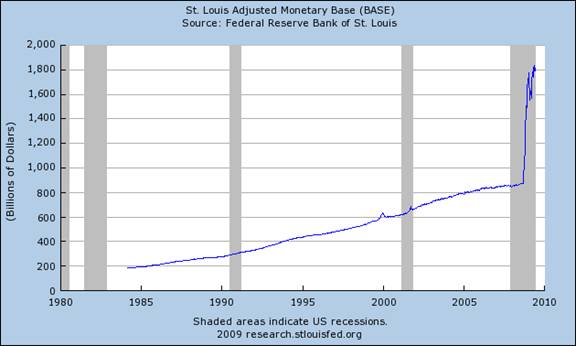
On the fundamental side, this is a chart that shows the amount of money the US Fed has pumped into the banks during the past 12 months. From 800 billion, an increase to 1.8 trillion dollars. By way of comparison, the small blip seen here at the end of 1999 was the money Mr. Greenspan pumped into the system during Y2K. The small blip seen in 2001 was his response to ‘911’. Nothing like this current increase has ever happened before, except in France during the 1790’s.
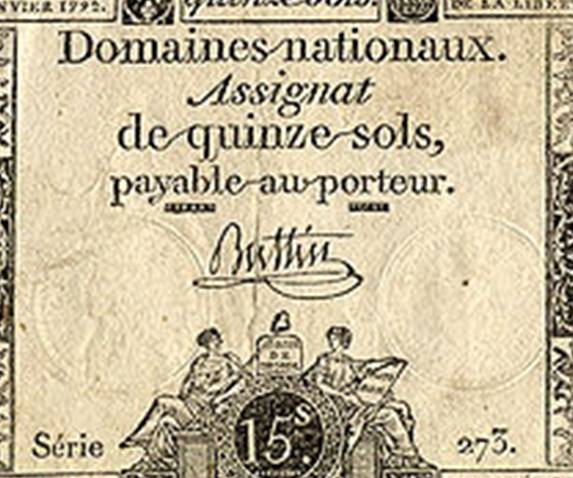
Featured is a French 15 Assignat dated 1792.
Or except in Germany in 1923
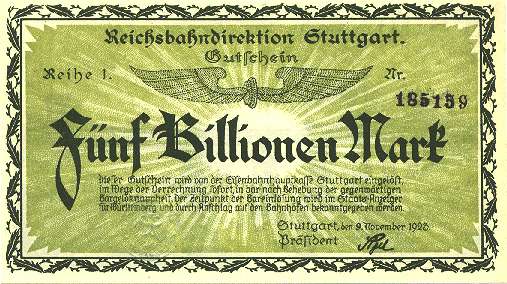
Featured is a German 5 Billion Mark dated 1923. By this time the printing presses were running 24/7 and the demand was so great (it took a wheelbarrow full to buy a meal at a restaurant), that banknotes were printed blank on one side, to save time and ink.

Or except more recently in Zimbabwe. This young Zimbabwean trillionaire was quoted as saying that ‘this toilet paper is a lot cheaper than the real thing’.
Summary: Markets move up and down with amazing regularity. The secret to success is to ‘swing along’ and not ‘against’ the cycles. Once you are sure the fundamentals are in place, (in this case a fixed supply of gold and increasing demand), you can afford to ‘buy the dips’ and ‘ride the waves’.
The billions of dollars that are being spent by the various governments, (including much of the money wasted on fighting Global Warming, which has little or nothing to do with human behavior – although conservation at the individual level and good stewardship always make sense), are going to result in ‘currency degradation’ and will end up causing prices for everyday goods and services to rise. Money wasted is nevertheless money spent, without an increase in goods. The price of gold (where supply is limited), will benefit.
Mr. John Coleman, who invented the Weather Channel, represents over 30,000 scientists who cannot get their voices heard on the main stream media, since they hold a viewpoint on Global Warming that runs opposite to the government and media template. The voices of reason are being suppressed.
(To hear Mr. Coleman, just Google him and click on the top You-tube).
The debt levels of 2008 exceed those of the 1873 depression as well at the 1929 depression. The derivative market runs in the hundreds of trillions of dollars.
Historically, once a country uses the printing press to pay for its stated goals and ongoing obligations, there is not one instance in human history where those debts and obligations are ever being paid off. These actions always have resulted in the destruction of the currency.
The unique aspect of today’s monetary inflation is that it is not limited to one country, but a host of countries are all inflating together.
As a result of the monetary inflation (when all of the newly created money begins to leave the banks and enter the system), the price inflation will be worldwide. It will not be limited to just one country as in the examples shown above.
There are presently more trends in the process of becoming exponential in existence than at any time in history. One of these trends is monetary creation. I posted a great video about this subject on my website. You will find it among the linked articles. The title is: “Exponential Trends”.
“From the ash heap of fiat currencies a phoenix will rise. This phoenix will have a bright yellow sheen. It will be measured in grams, ounces and tonnes”.
Happy trading!
By Peter Degraaf
Peter Degraaf is an on-line stock trader with over 50 years of investing experience. He issues a weekend report on the markets for his many subscribers. For a sample issue send him an E-mail at itiswell@cogeco.net , or visit his website at www.pdegraaf.com where you will find many long-term charts, as well as an interesting collection of Worthwhile Quotes that make for fascinating reading.
DISCLAIMER: Please do your own due diligence. I am NOT responsible for your trading decisions.
Peter Degraaf Archive |
© 2005-2022 http://www.MarketOracle.co.uk - The Market Oracle is a FREE Daily Financial Markets Analysis & Forecasting online publication.