


Investor Downside Risk Protection, Stop Loss Orders vs. Protective Put Options
InvestorEducation / Learning to Invest Jun 20, 2009 - 06:06 PM GMTBy: Hans_Wagner

 If you have been investing for a while, you know it is good practice to have a stop loss in place. You might have heard that pros use protective put options to reduce their downside risk. It is always important to have downside protection on any stock position you own. Investors use stop loss orders and protective put options to provide this protection. The stop loss is the most popular. However, many professional investors use protective puts to insure against losses. Which is the best method for you?
Background
Adding downside protection provides a cushion should the underlying asset suffer a loss. Most professional traders and investors employ some form of downside protection to hedge their portfolio positions. The challenge investors’ face is how much downside protection should be in place given the risk and the potential return. The type and amount of down side protection depends on the investor’s perspective of the market, the sector, and the stock.
Many investors employ stop loss techniques to reduce their loss or to capture an unrealized gain. Stop loss prices can be set at or below recent lows, or based on the volatility of the stock or at a set percent that the investor does not wish to loose.
Protective put options offer investors another way to reduce the risk of a loss in their stock. Buying an out-of-the-money put where the strike price is just below the stock price, gives the investor the lowest price they can sell their stock. If the stock falls below the strike price, you can still sell your shares at the strike price. On the other hand, you can sell the put option since it will have risen in price as the price of the underlying shares fall. Many professional investors use protective put options.
This raises the question, which technique should you use to reduce downside risk? What follows is a test of a stop loss and the protective put option, using Apple over a two-year period beginning the end of May 2007 to the end of May 2009. Apple was purchased at the closing price on May 31, 2007 for both accounts. This period covers a rally in Apple, a significant move down followed by another rally to approximately the same price two years later.
After the execution of a stop loss order, a new buy order was completed later as indicated on the chart. For the protective put test, shares of Apple are held for the two-year period, as it was unnecessary to trade Apple’s shares. Trading costs are not considered.
Performance is recorded as though only one share was traded, rather than assume a set number of shares.
Stop Loss Performance
Many investors use stop orders to limit their losses and capture profits. There are several methods investors use to set their stop orders, including those based on a set percent, volatility and just below a recent support level. For this test, we are using a stop sell order that is at the recent low. A sale takes place when the price falls to the stop order level.
There are a number of methods to make the buy decision. For this test, all buys of a share of Apple are made when the daily MACD (Moving Average Convergence Divergence) indicator rises through its nine-day moving average. This is the same price used to sell the protective put option, helping to make the comparison equal.
For the analysis of stop loss orders as an effective downside insurance vehicle, I employed the following rules on where to set the stop loss order and to buy shares of Apple:
- Use the MACD as the buy shares indicator.
- Buy shares of Apple when the MACD is below zero and it turns up through the 9-day moving average (green vertical line).
- Price of buy orders are set at the closing price of the day.
- The stop loss order is set at the most recent trading low. A small parallel red line marks the stop on the chart.
- When the price falls back down to this price a sell order is executed at the price of the stop.
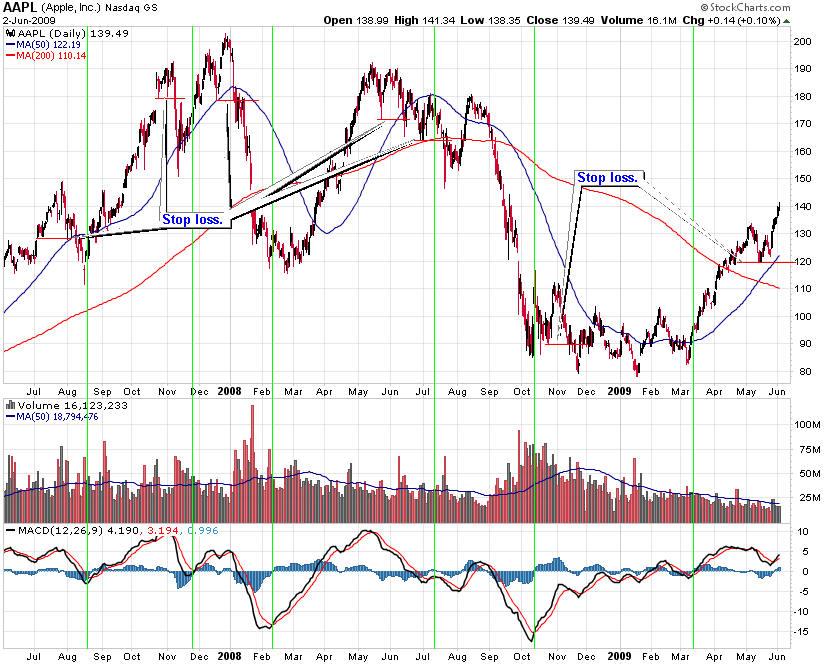
The table below records the gains and losses from each trade. The investor ended the two-year period having bought Apple at the latest buy signal with the current stop set at $119.38. The latest gain is unrealized, as a stop has not been executed. Along the way, you would have gained $118.45 points over the two-year period. In addition, you would have missed the bulk of the move down that took place in early 2008 and again in September 2008.
| Stop Loss Results | ||||
| Buy Date | Apple Price | Sell date | Stop Price | Gain/Loss |
| 31-May-07 | $ 121.19 | 1-Aug-07 | $ 132.75 | $ 11.56 |
| 21-Aug-07 | $ 127.57 | 8-Nov-07 | $ 175.47 | $ 47.90 |
| 27-Nov-07 | $ 175.47 | 7-Jan-08 | $ 178.60 | $ 3.13 |
| 12-Feb-08 | $ 125.20 | 12-Jun-08 | $ 172.00 | $ 46.80 |
| 14-Oct-08 | $ 104.08 | 12-Nov-08 | $ 90.11 | $ (13.97) |
| 12-Mar-09 | $ 96.35 | 29-May-09 | $ 119.38 | $ 23.03 |
| Gain with Stop Loss | $ 118.45 | |||
Protective Put Performance
Protective put options offer investors another way to hedge their downside risk. A put option gives the owner the right to sell the underlying security at the strike price until the option expires. As an option nears e\the expiration date the affect of the decay in time premium becomes more pronounced. Therefore, most investors buy puts that have several months until they expire, so they avoid the largest part of the time decay.
For our analysis of protective puts as an effective downside insurance vehicle, I employed the following rules on when to buy and sell the protective put:
- Use the MACD as the indicator to buy and sell put options.
- Buy protective puts when the MACD is above zero and it turns down through the 9-day moving average (red vertical line).
- Sell the protective put when the MACD is below zero and the MACD rises through the 9-day moving average (green vertical line).
- Buy protective puts with more than 100 days until expiration.
- Buy the first in-the-money protective put.
- Use the closing price of the day for the buy and sell price.
The chart below of Apple covers the same period as the stop loss example above. It shows the purchase of protective puts (red line) and the sales (green line).
The table below shows the results had you used protective puts to reduce your downside risk while owning shares of Apple. The gain on trading protective put options generated $104.45 points during the two-year period. The largest gains came during the major falls in price in early 2008 and again during September 2008 through October 2008. When the two-year period ended, you would still own your shares of Apple. Your next trade will come when the MACD of Apple falls through its 9-day moving average. Along the way, you continue to enjoy ownership of Apple.
| Protective Put Results | ||||||||
| Buy Date | Apple Price | Put Price | Sell date | Apple Price | Put Price | Gain/Loss | Protective Put Option | |
| 30-Jul-07 | $ 131.75 | $ 7.65 | 21-Aug-07 | $ 127.57 | $ 10.85 | $ 3.20 | Oct 135 | |
| 8-Nov-07 | $ 175.47 | $ 14.60 | 27-Nov-07 | $ 174.81 | $ 14.60 | $ - | March 180 | |
| 4-Jan-08 | $ 179.98 | $ 9.50 | 12-Feb-08 | $ 125.20 | $ 50.40 | $ 40.90 | April 180 | |
| 21-May-08 | $ 178.19 | $ 10.10 | 7-Jul-08 | $ 175.16 | $ 12.40 | $ 2.30 | Sept 180 | |
| 3-Sep-08 | $ 166.96 | $ 13.50 | 14-Oct-08 | $ 104.08 | $ 74.20 | $ 60.70 | Jan 170 | |
| 18-Feb-09 | $ 94.53 | $ 10.85 | 12-Mar-09 | $ 96.35 | $ 8.20 | $ (2.65) | June 95 | |
| Gain on Protective Puts | $ 104.45 | |||||||
| Gain on Shares | 31-May-07 | $ 121.19 | 29-May-09 | $ 134.41 | $ 13.22 | |||
| Total Gain | $ 117.67 | |||||||
Results of this non-Scientific Test
This test shows both approaches provide excellent downside protection. The stop loss technique kept you from incurring significant losses, while the protective put took advantage of the steep drops in the price of Apple.
From this sample, the protective put strategy produced the greatest return when Apple experienced the largest fall in the share price. This is the primary purpose of a put option. On the other hand, the stop loss generated consistent gains in the underlying stock, which is the purpose of the stop loss. One conclusion you can draw from this is be sure to use downside protection with your long positions.
In this test, the price of Apple was highly volatile. It is possible a less volatile stock would generate a different result. That will be a test for the future.
The Bottom Line
Most professional investors use put options rather than stop loss orders. One of the reasons is they are protected again sit a major loss should the stock price gap down below the stop price. In this case, the investor using the stop loss order would not receive their expected price, but whatever price the stock eventually sold due to the gap. The investor owning put options still can sell their shares at the strike price, no matter how far the stock gapped down.
Then there is the case of the stop being executed and the stock rebounds shortly after rising to new highs. In this case, the investor would not be able to participate in the gain unless they bought at a higher price. Whereas the investor using put options would still own their stock.
Regardless of which approach you select, it is important to employ downside protection for your long stock positions.
If you want to learn more about using options consider reading Options Made Easy: Your Guide to Profitable Trading (2nd Edition) by Guy Cohen. It is a good way to help you to get started learning how to use put options to reduce your down side risk.
Our Premium Members receive suggestions on when to use roll call options to reduce the down side risk of various portfolio positions. If you are interested in learning how to use call options, you should give our four-week free trial to the Premium Membership a try. There is no risk, nor any obligation. If you have any questions regarding membership, please send an email to service@tradingonlinemarkets.com and we will get right back to you. Your complete satisfaction is of utmost importance to us.
By Hans Wagner
tradingonlinemarkets.com
My Name is Hans Wagner and as a long time investor, I was fortunate to retire at 55. I believe you can employ simple investment principles to find and evaluate companies before committing one's hard earned money. Recently, after my children and their friends graduated from college, I found my self helping them to learn about the stock market and investing in stocks. As a result I created a website that provides a growing set of information on many investing topics along with sample portfolios that consistently beat the market at http://www.tradingonlinemarkets.com/
Copyright © 2009 Hans Wagner
Hans Wagner Archive |
© 2005-2022 http://www.MarketOracle.co.uk - The Market Oracle is a FREE Daily Financial Markets Analysis & Forecasting online publication.