


Analysis of Sentiment Suggests that Precious Metals Are Likely to Shine Once Again
Commodities / Gold & Silver 2009 Jun 22, 2009 - 09:12 AM GMT

 This essay is based on the Premium Update posted on June 20th, 2009 - In my previous Premium Update I have emphasized the meaning of sentiment and how one can analyze it to gain advantage over other market participants. I have received very positive feedback after posting it, so I decided to include a part of this week’s update dedicated to sentiment also into the publicly available free commentary.
Last week I mentioned two common indicators that can help gauge sentiment: the S&P Energy Sector Bullish Percent Index and Gold Miners Bullish Percent Index. From our point of view, as precious metals investors, it is the Gold Miners Bullish Percent Index that is particularly interesting. Charts are courtesy of stockcharts.com.
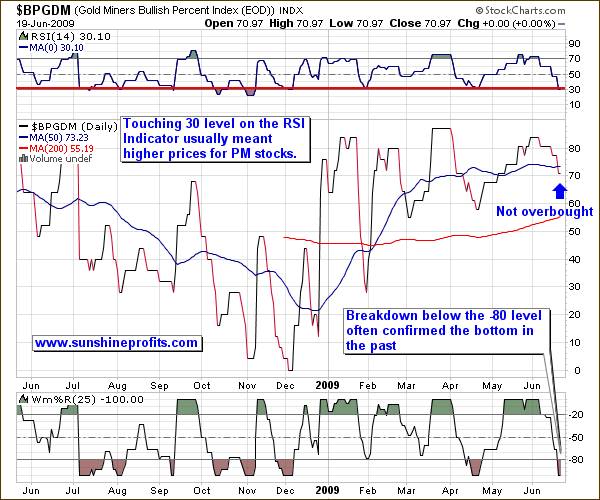
The Gold Miners Bullish Percent Index is a market breadth/momentum indicator and is calculated by dividing two numbers: the amount of gold stocks on the buy signal (according to the point and figure chart which emphasizes strong moves while ignoring small ones) and the amount of all the gold stocks in the sector. If every gold stock is rising, then the value of the index will be at 100%, which raises a red flag, as everyone interested in the market is already in, and the top will soon emerge. If we’re looking at sentiment, substantial momentum usually corresponds to investors eager to jump in at quickly rising prices because they believe prices will continue much higher and are afraid of being left behind.
If we said that at 100% the indicator shows overbought conditions, then you can see on the above chart that at the current 70% level the indicator is not extremely overbought, nor is it oversold. The Gold Miners Bullish Percent Index is no longer signaling that lower prices are to be expected, which was the case several weeks ago. Since the value of the index does not need to be at the oversold levels for a local bottom to form (still it is helpful in timing the major bottoms), we might need to look for additional tools to help us.
If you look closely you will notice two such additional tools in the above chart. The RSI (Relative Strength Index) is a technical momentum indicator that compares the magnitude of recent gains to recent losses in an attempt to determine overbought and oversold conditions.
The RSI also ranges from 0 to 100 with an asset deemed to be overbought once the RSI approaches the 70 level, meaning that it may be getting overvalued and is a good candidate for a pullback. Likewise, if the RSI approaches 30, it is an indication that the asset may be getting oversold and likely to become undervalued. If you look at the RSI indicator in the above chart, you can clearly see that it in fact just touched the 30 mark.
Another indicator on this chart is the Williams %R, also a momentum indicator that is especially popular for measuring overbought and oversold levels. Named for its developer, Larry Williams, the scale ranges from 0 to -100 with readings from 0 to -20 considered overbought, and readings from -80 to -100 considered oversold. What I find particularly interesting here, is that the %R indicator has signaled a “temporary oversold” territory only once in 2009 – and that corresponded to the long-term buying point (also signaled by the SP Gold Bottom Indicator), and a powerful rally. The last time the %R indicator for Gold miners Bullish Percent index hit the 100 level was on April 17th when gold closed at $869. A powerful rally followed which took gold to $989 in about six weeks. The same signal has just appeared in the recent days with the Williams %R at 80, which suggests that we will see PMs higher in the not too distant future.
Please keep in mind that none of this is a “sure bet” that we will immediately go higher – there are no certainties in any market. However, in my opinion this scenario is likely and it seems that it will be profitable to bet on higher precious metals and mining stocks prices and to position yourself accordingly.
Moving on to the technical analysis of the precious metals sector, I will begin with the gold chart.
Gold
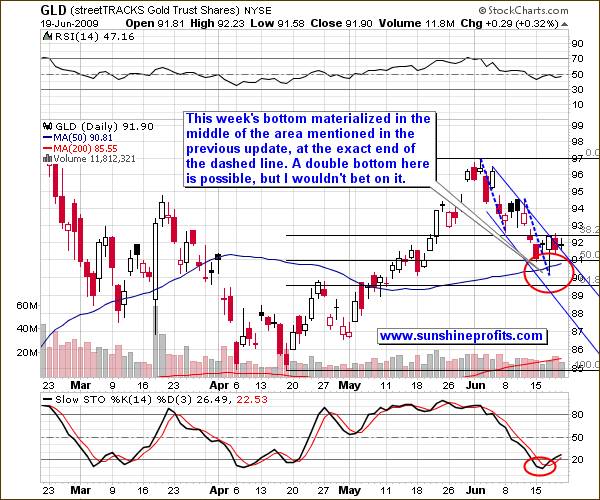
The above chart suggests that the bottom might be already in place, as the support levels have been reached. The 50% Fibonacci retracement level is particularly important here, as gold often corrects 38.2%, 50%, or 61.8% of the preceding rally, before moving higher. The bottom materialized precisely in middle of the predicted area, and it has been confirmed by the “buy” signal from the stochastic indicator.
The latter is a momentum indicator that shows the location of the current close relative to the high/low range over a set number of periods. Closing levels that are consistently near the top of the range indicate buying pressure and those near the bottom of the range show selling pressure. It has crossed its moving average (red slope) and is now moving higher. This meant higher gold prices in the past, so it is likely to be the case also now. Please note that during the previous several months, each time such a signal corresponded to a local bottom in gold.
Although I don’t view this as highly probable, one more test of this week’s low is not out of the question.
Silver
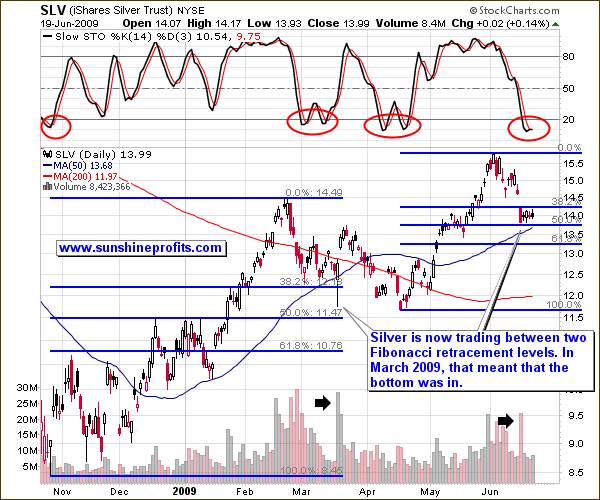
Silver has also moved to the levels mentioned last week. The Fibonacci levels are similar to what happened in March. The action in the stochastic indicator suggests that we may in fact see a double bottom here. However, please remember that technical signals on the silver market are less meaningful than in other markets.
Additionally, please note that the March bottom took place on very high volume. The Monday low when the SLV ETF closed at 13.83 also was characterized by very high volume, which suggests that this bottom was a significant one. While it’s true that history does not always repeat itself, it does so frequently enough to use this principle in one’s trading.
Summary
Precious metals have declined this week, as indicated in the previous Premium Update. The sector has been falling for 3 consecutive weeks, since the beginning of June, and that alone suggests that at least a breather is to be expected. Still, there are many factors that suggest that a bottom has already been put this week. While this may turn out to be the first bottom, of the double-bottom formation, this is not very likely. Obviously, it can happen, but if it does, it likely will be a temporary phenomenon. I will be monitoring markets closely and report to my Subscribers.
To make sure that you get immediate access to my thoughts on the market, including information not available publicly, I urge you to sign up for my free e-mail list. Sign up today and you’ll also get free, 7-day access to the Premium Sections on my website, including valuable tools and charts dedicated to serious PM investors and speculators. It’s free and you may unsubscribe at any time.
P. Radomski
Editor
Sunshine Profits
Interested in increasing your profits in the PM sector? Want to know which stocks to buy? Would you like to improve your risk/reward ratio?
Sunshine Profits provides professional support for precious metals Investors and Traders.
Apart from weekly Premium Updates and quick Market Alerts, members of the Sunshine Profits’ Premium Service gain access to Charts, Tools and Key Principles sections. Click the following link to find out how many benefits this means to you. Naturally, you may browse the sample version and easily sing-up for a free trial to see if the Premium Service meets your expectations.
All essays, research and information found above represent analyses and opinions of Mr. Radomski and Sunshine Profits' associates only. As such, it may prove wrong and be a subject to change without notice. Opinions and analyses were based on data available to authors of respective essays at the time of writing. Although the information provided above is based on careful research and sources that are believed to be accurate, Mr. Radomski and his associates do not guarantee the accuracy or thoroughness of the data or information reported. The opinions published above belong to Mr. Radomski or respective associates and are neither an offer nor a recommendation to purchase or sell securities. Mr. Radomski is not a Registered Securities Advisor. Mr. Radomski does not recommend services, products, business or investment in any company mentioned in any of his essays or reports. Materials published above have been prepared for your private use and their sole purpose is to educate readers about various investments.
By reading Mr. Radomski's essays or reports you fully agree that he will not be held responsible or liable for any decisions you make regarding any information provided in these essays or reports. Investing, trading and speculation in any financial markets may involve high risk of loss. We strongly advise that you consult a certified investment advisor and we encourage you to do your own research before making any investment decision. Mr. Radomski, Sunshine Profits' employees and affiliates as well as members of their families may have a short or long position in any securities, including those mentioned in any of the reports or essays, and may make additional purchases and/or sales of those securities without notice.
Przemyslaw RadomskiArchive |
© 2005-2022 http://www.MarketOracle.co.uk - The Market Oracle is a FREE Daily Financial Markets Analysis & Forecasting online publication.