


Gold Price Is Boiling Hot!
Commodities / Gold & Silver 2009 Jun 22, 2009 - 10:24 AM GMTBy: Ronald_Rosen

 Excerpt From The Walrus and The Carpenter By Lewis Carroll
 “The time has come, the Walrus said,
To talk of many things:
Of shoes - and ships - and sealing-wax
Of cabbages - and kings
And why the sea is boiling hot –
And whether pigs have wings."
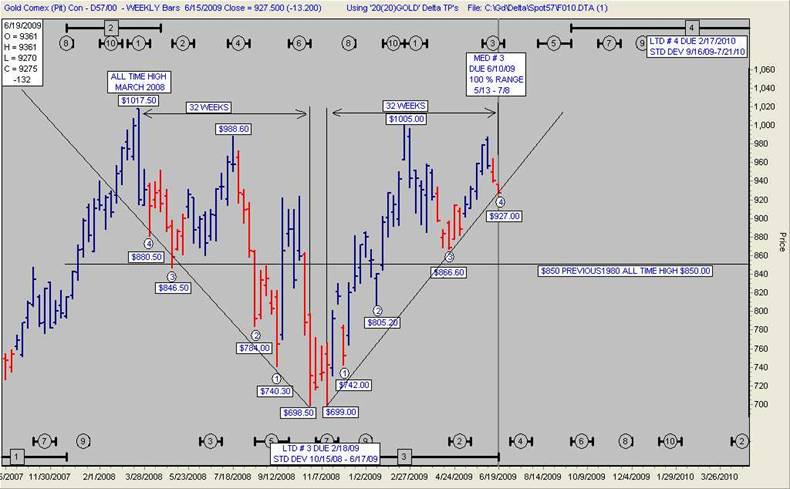
THE WEEKLY GOLD CHART
The weekly chart of gold is telling us that the price is “boiling hot.” It further says that “The time has come…” to put aside fears and worries about sell offs and corrections. Starting at the all time high of $1,017.50 achieved in March of 2008, gold declined for 32 weeks. The low was made at $698.50. The low of $698.50 was followed by 2 weeks of sideways action. This was followed by a double bottom at $699.00. This week, the week of June 15, 2009, is the 32nd week that gold has been rising since the double bottom at $699.00.
Starting at the high at $1,017.50 there are four distinct descending bottoms plus the bottom at $698.50. Starting at the top, I have labeled the descending bottoms 4, 3, 2, 1.
Starting at the double bottom of $699.00 there are four distinct ascending bottoms. These rising bottoms are labeled 1, 2, 3, and 4.
The low of $699.00 is obviously higher than the low of $698.50.
Starting at $699.00 each of the ascending bottoms bottomed at a price higher than the corresponding descending bottom.
The pressure is on the buy side all the way up. This is evidence that LTD # 4 high is pulling the price of gold higher. LTD # 4 high is not due to arrive until February 10, 2010. The 100% range for arrival extends out to December 2010.
This chart is telling us that there will be a new closing high in a matter of weeks, not months. Once a new closing high is achieved the price may run up for a while. Once the price of gold temporarily stops rising after making new all time highs the most natural occurrence would be a decline back below the breakout level of $1,017.50. “Hunting parties” will take the price down in order to trigger off and pick up sell stops underneath but too close to the previous high. This is not a prediction; it is a projection of what I believe the weekly gold chart is telling us. So, keep that in mind if you are trading gold.
GOLD WEEKLY
Now for the esoteric part that may be difficult to digest. It is my belief that nothing can hold back the gold market at this point in time except government calling out the troops to confiscate all gold holdings.
The gold bull market is almost 10 years old. As time moves on the corrections will not automatically repeat in time or extent. Regardless of any and all attempts, by any government or collection of governments, to manipulate or interfere in the gold market in order to hold back the price, the time for this bull market is limited by Nature as expressed through those participating and about to participate. Therefore, the full expression of the gold bull market is limited in time. As time runs out the amount of work left to be done may be enormous. That means a huge rise, if due to occur, must take place in a short period of time. Thus, a parabolic rise is the result. This is a huge move in a short period of time. I doubt that those in government necessarily believe that they are limited in time by nature in what they can do to hold back the price of gold. Can there be a momentary break of the 50 and 200 day moving averages. Yes, of course, but the time involved in a break of the moving averages will be less than momentary. If I am correct, the snap back will be quicker than the time consumed in a break. I think you get the picture of where I am coming from. It is Mother Nature who makes the rules and the final decisions and not any mortals in government positions, elected or appointed.
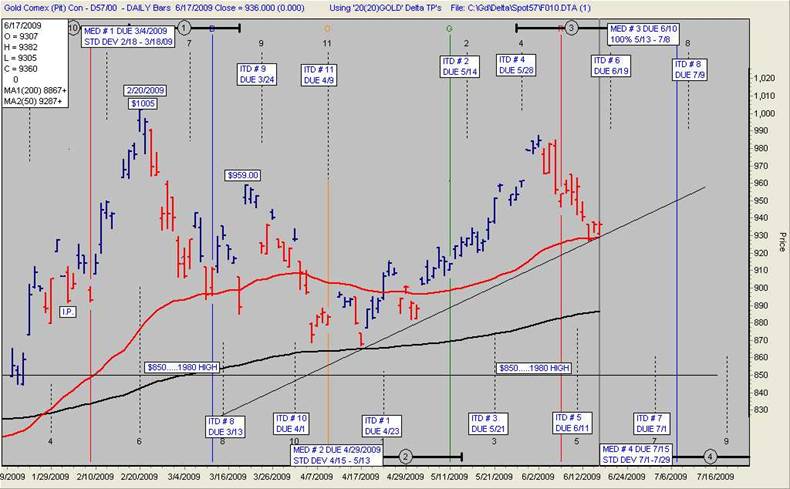
The rising trend line has not been violated since it began 11/13/2008. I believe that a new high in gold, if it is to occur soon, will momentarily top in the vicinity of ITD # 8 high. That would produce a momentary top within the 100% range of MTD # 3 high. ITD # 8 high and MTD # 3 high would arrive together under this scenario.
The red line is the 50 day moving average. The black line is the 200 day moving average.
Remember, a momentary intra-week trend line break may occur. However, I doubt that an inter week closing break will occur.
GOLD DAILY
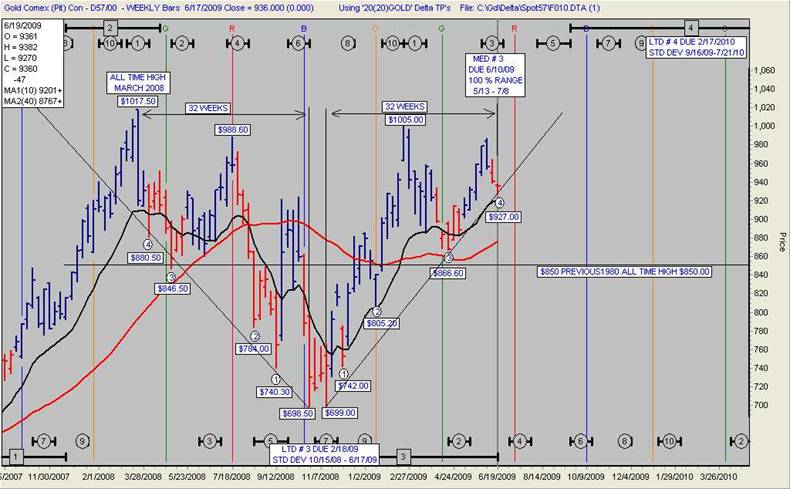
The black line is the 10 week moving average (50 days). The red line is the 40 week moving average (200 days).
Please remember this: an intra week rising trend line break is possible. Inter week rising trend line break is a low probability.
We shall see just how valid my hard earned belief really is. The belief is that good old Mother Nature runs the show whether we like it or not. We are knowingly or unknowingly her instruments.
Ron Rosen
GOLD WEEKLY
Subscriptions to the Rosen Market Timing Letter with the Delta Turning Points for gold, silver, stock indices, dollar index, crude oil and many other items are available at: www.wilder-concepts.com/rosenletter.aspx
Ron Rosen and Alistair Gilbert
M I G H T Y I N S P I R I T


Ronald L. Rosen served in the U.S.Navy, with two combat tours Korean War. He later graduated from New York University and became a Registered Representative, stock and commodity broker with Carl M. Loeb, Rhodes & Co. and then Carter, Berlind and Weill. He retired to become private investor and is a director of the Delta Society International
Disclaimer: The contents of this letter represent the opinions of Ronald L. Rosen and Alistair Gilbert Nothing contained herein is intended as investment advice or recommendations for specific investment decisions, and you should not rely on it as such. Ronald L. Rosen and Alistair Gilbert are not registered investment advisors. Information and analysis above are derived from sources and using methods believed to be reliable, but Ronald L. Rosen and Alistair Gilbert cannot accept responsibility for any trading losses you may incur as a result of your reliance on this analysis and will not be held liable for the consequence of reliance upon any opinion or statement contained herein or any omission. Individuals should consult with their broker and personal financial advisors before engaging in any trading activities. Do your own due diligence regarding personal investment decisions.
Ronald Rosen Archive |
© 2005-2022 http://www.MarketOracle.co.uk - The Market Oracle is a FREE Daily Financial Markets Analysis & Forecasting online publication.