


GOLD Analysis and Trading Strategy
Commodities / Gold & Silver 2009 Jun 22, 2009 - 02:16 PM GMTBy: Florian_Grummes

 Here is my bi-weekly gold report in different currencies.
Gold spot price Analysis - Gold in USD (1 ounce = US$ 933.50)
The correction since the top from US$990 (3rd of June) continued as expected during the last 2 weeks. So far the lows have been seen last Monday at US$925.
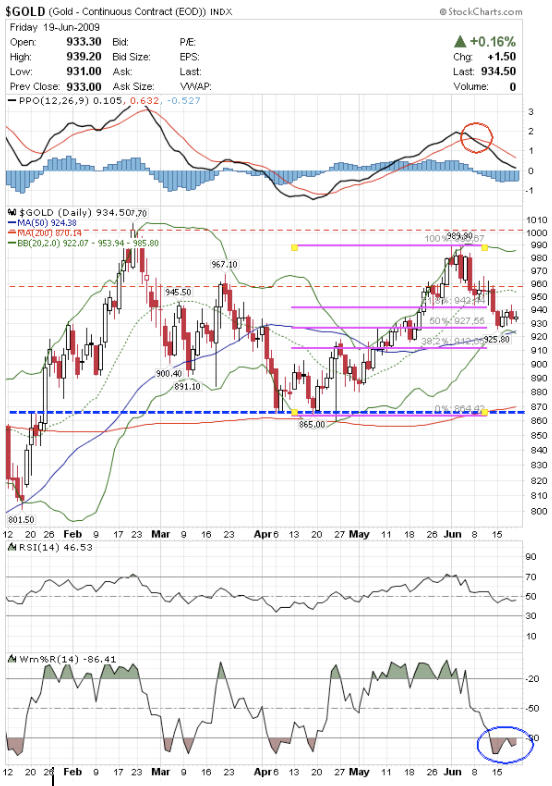
In the bigger picture the correction since the all time high in March 2008 (US$ 1.037) is still in play. To end the correction a sustainable move above of the US$1.000 mark is necessary. (Note: It took the Dow Jones more than two years to break through the very important psychological barrier of 1000 points).
Until now the sell off is pretty slow. The 50d MA (US$ 924.28) has already been tested. The lower Bollinger Band (US$ 922.07) supports that area too. Also the 50% Fibonacchi Retracement has been hit.
If the support at US$ 930-925 fails we will probably see a further and accelerated correction down to the slowly rising 200d MA (actually US$ 870.14). The 200d MA is the next really strong support.
Short term gold gained only a few dollars since the low at US$ 925. Every recovery failed already at the level of US$940. That is a clear sign of weakness. In previous times the price of gold turned quite fast as soon as the market had reached the bottom. Until now we have not seen this pattern.
As well the Gold market right now is completely depending on the development in the US-Dollar The Dollar Index could rise back up to its 200d MA at around 83.50 during the next couple of months.
During the coming summer months I expect a continued correction. But in the very short term gold is oversold and in case that the US$930 should hold I expect a bounce back to US$950-965. After that we should see a test of the 200d MA below US$900.
Any move above US$965 instead would be a clear buying signal and should lead to a quick move above US$1.000.
The long term technical & fundamental perspective for gold is still super bullish. The next price targets are the Fibonacci‐Extensions of the correction since March 2008 at 1250$ and 1600$. These should be reached until spring 2010.
Das DowJones/Gold Ratio is actually 9.14. That ratio nearly didn’t change throughout the last four weeks. But now it seems that the stock markets have seen their tops and the trend is turning down. The DAX is already clearly below 5.000 points. The summer is coming and the trading volume is getting lower.
Long term I expect the price of gold moving towards parity to the Dow Jones (=1:1) The next primary cyclical change is still years away. This means we are still in a long-term bull market in gold (and also commodities) and in a secular bear market in the broad stock market.
Gold in EUR (one ounce = 669.89€)
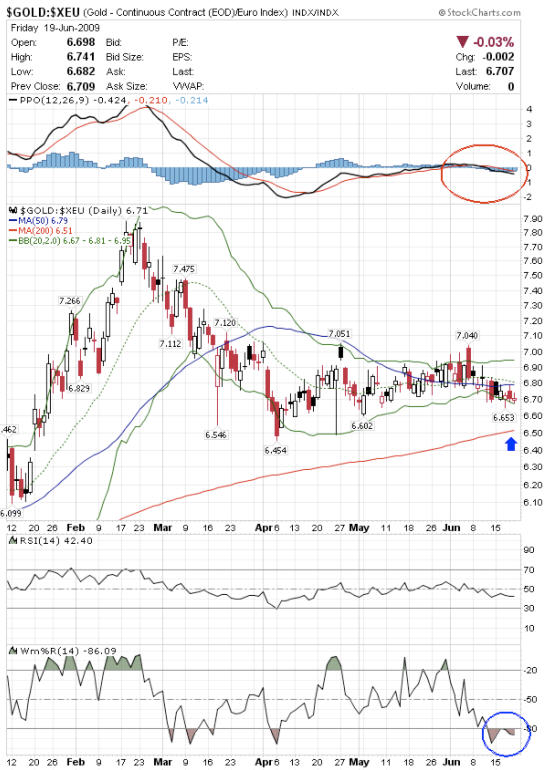
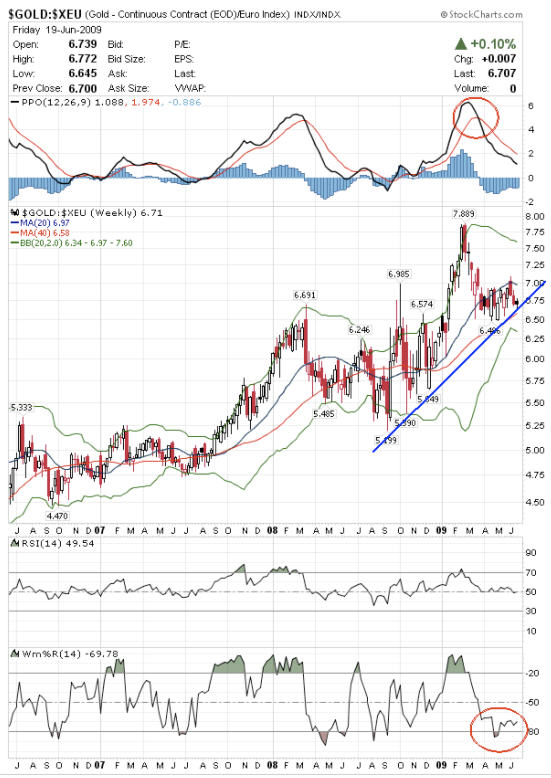
- EUR-Gold lost about 2% per ounce (13.30€ ) since the last issue.
- This means that the 50d MA at 679€ is now broken and during the summer the rising 200d MA (actually 651€) will probably be tested.
- Both Bollinger Bands indicate a further down move. Altogether EUR-Gold moves in a relatively tight sideways range. After the break of 680€ you should expect a further down move to 650€.
- Be consequent and buy physical bullion with prices below 670€.
Gold COT Situation
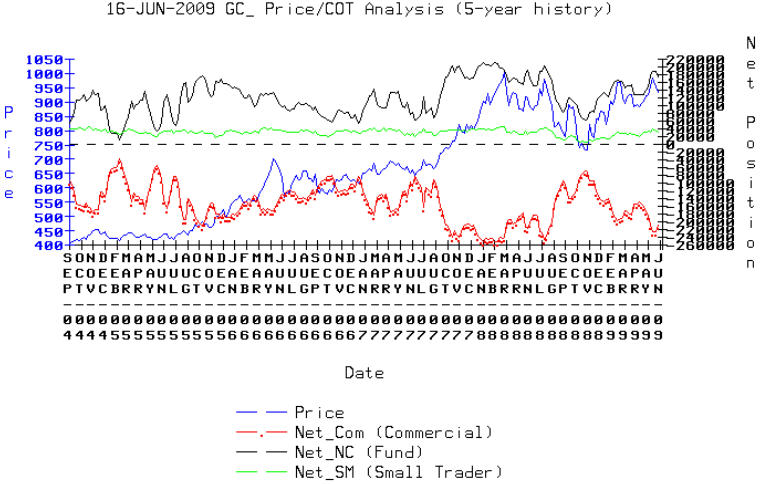
- The COT data are still the main reason why I am so skeptic about a Gold rally in the next few weeks & months.
- The well-informed commercials did only cover 7,5% of their short positions during the last couple of weeks while Gold itself lost more than US$60. This means we have to expect more correction to the downside.
- I still believe that a new big sustainable rally in the price of gold will only start, if the commercials reduce their short positions below 100.000 contracts.
17.02.2009 = -196.360 ( PoG Low of the day = US$ 970 )
10.03.2009 = -172.851 ( PoG Low of the day = US$ 892 )
18.04.2009 = -153.419 ( PoG Low of the day = US$ 885 )
19.05.2009 = -183.065 ( PoG Low of the day = US$ 920 )
26.05.2009 = -208.136 ( PoG Low of the day = US$ 939 )
02.06.2009 = -226.521 ( PoG Low of the day = US$ 970 )
09.06.2009 = -225.047 ( PoG Low of the day = US$ 947 )
16.06.2009 = -207.368 ( PoG Low of the day = US$ 929 )
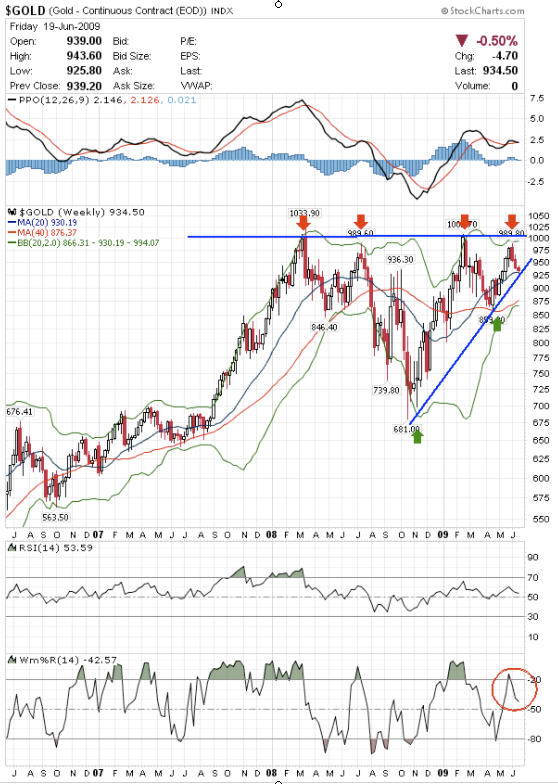
Gold Seasonality
According to the typical seasonal pattern we have witnessed the high of the winter rally at US$1.006 in late February.
The spring top, which is normally lower than the winter top, was reached on the 3rd of June at US$ 990.
The summer is coming: during that period of the year the volume is reduced and most of the markets are moving lower. So enjoy the sun and your holidays.
Gold Sentiment
The sentiment is still too bullish – analysts, investment newsletters and investment websites are very positive for gold. Normally the majority is wrong and a new strong rally needs a pessimistic expectancy of the masses. Before the strongest bull markets the majority of the investors normally gets kicked out while the „smart“ money can position itself on the right side in preparation for the next move.
Conclusion
It is not easy to interpret the current correction. But I expect that we will see prices around US$900 within the next weeks. Prerequisite for this is an ongoing recovery in the US-Dollar Index.
In the moment it is impossible to say, whether we will see a next fulminate up move in late summer/ early autumn. Actually the COT data contradict that. If the stock market takes another hit down gold and especially gold stocks will face selling pressure. Also the physical demand is pretty weak. From that perspective the probability of a strong sell off down to US$700 has risen.
A lot of analysts expect a dramatic inflation very soon to happen – but since summer 2007 we have faced a heavy loss of assets worth around 50 trillion USD worldwide. Compared to that all the money spent by the governments and central banks are a drop in the bucket. For the moment the banks will repair their balance sheets (= deleverage) and be quite cautious with lending money.
Goldmining stocks Analysis
Goldbugs Index USD (339.88 points)
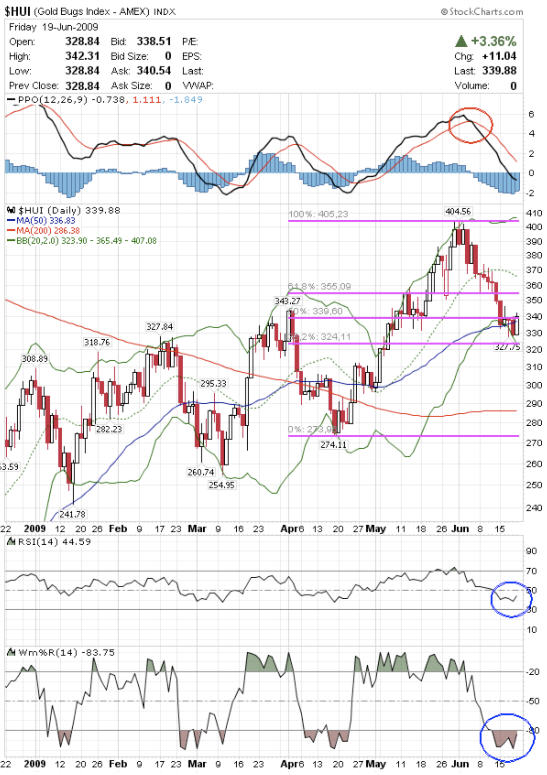
In the last 20 days the HUI lost around 19%. Since the low on Thursday around 328 points the index recovered 4,5% so far.
The correction stopped pretty exactly at the 61,8% Fibonacchi Retracement of the last bull move since mid of April. As well at this level the 50d MA (actually 336.83) and the lower Bollinger Band (actually 323,90) support the market.
Short term the gold mining stocks are oversold and a recovery would not be a surprise. This short term bounce could reach the level of 355 – 375 points. After this I expect another down move. The flat 200d MA (actually 286.38) is more than 50 points away and indicates more need for correction.
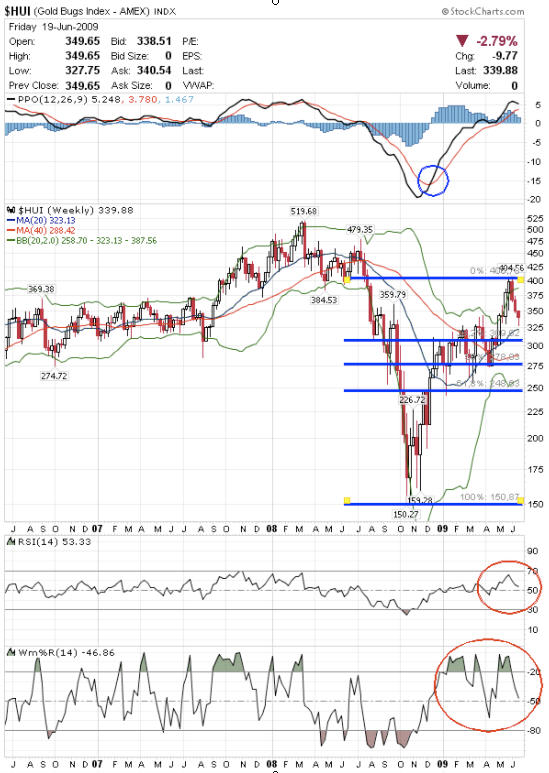
A look on the weekly chart shows that a correction can go down to 250 points over the next months. At 250 we can find the 61,8% Fibonacchi Retracement of the complete rally since last November. Most importantly the PPO/MACD indicator on the weekly chart clearly shows that there might come much better entry points for buying the gold mining sector again.
To get my Free Gold Trading Analysis & Strategy please visit my website at: www.TheSilverGoldSpot.com
By Florian Grummes
www.TheSilverGoldSpot.com
Learn to Trade ETF's While Your Making Money Trading
© 2009 Copyright Florian Grummes - All Rights Reserved
Disclaimer: The above is a matter of opinion provided for general information purposes only and is not intended as investment advice. Information and analysis above are derived from sources and utilising methods believed to be reliable, but we cannot accept responsibility for any losses you may incur as a result of this analysis. Individuals should consult with their personal financial advisors.
Florian Grummes Archive |
© 2005-2022 http://www.MarketOracle.co.uk - The Market Oracle is a FREE Daily Financial Markets Analysis & Forecasting online publication.