


GOLD, A Case for the Bulls
Commodities / Gold & Silver 2009 Jun 23, 2009 - 10:11 AM GMTBy: Alistair_Gilbert

 The last year has seen some pretty dramatic falls in commodity prices but Gold actually managed to end 2008 as one of the best performing investments with a gain of about 5%. This was despite the fact that Gold normally rises inversely to the dollar and last year the dollar rose relentlessly, catching a lot of people off guard. This reinforced its reputation as a safe port when all around is chaos. This reputation has been garnered over 5,000 years, but during the boom stockmarket era of the 80s and 90s it lost a lot of its glitter as investors found better returns elsewhere.
The stockmarket crash in 2000 awakened interest amongst investors and it has risen from $250 to $950 over the last ten years, outperforming most stockmarket investments. This may sound like a good performance, but it is only the start, as it has a lot of catching up to do. In January 1980, Gold stood at $850, but if we were to take into account inflation since 1980, it would need to be $2,300. If we go back to 1970 when the last Bull market started, and taking into account the inflation of the 70s, Gold would need to be $4,700 per ounce today. So, this is a minimum target that we can expect over the next 5 years, but what other corroborating evidence do we have that justifies this price (or an even higher price)? Well, if we look at the DOW/Gold ratio over the last 109 years we can see that there is a regular cycle which happens every 36 years and lasts about 14 years.
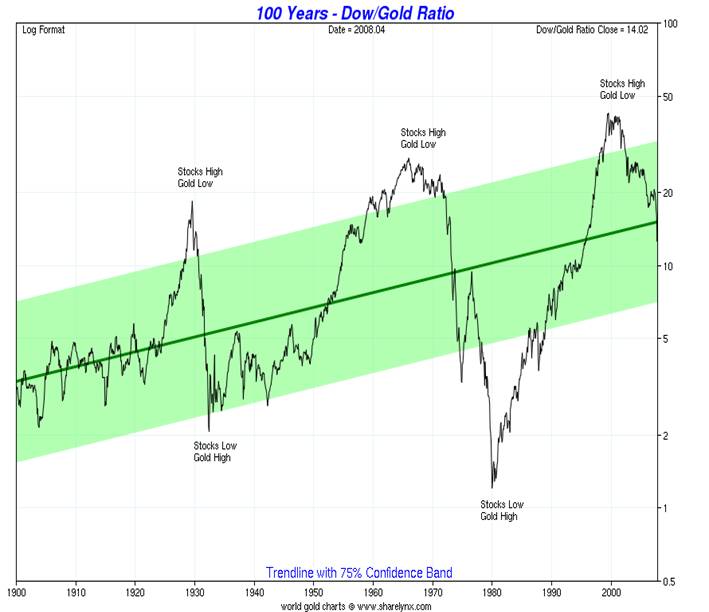
If we look at the pattern on this chart, it is known as a Megaphone pattern. This means that each high is higher and each low is lower and is a very bearish pattern. It is currently projecting down to about 0.6 from a current reading of about 9. This means that if the DOW were to stay static over the next 5 years, then Gold would go to $14,250!!! If the DOW were to drop to 2,000 (as may happen) then Gold would still rise to $3,562. The important thing to recognise is that Gold will significantly outperform the DOW over the next 5 years.
We still do not know how the “C” wave will play out in the DOW because whilst the “A” wave lasted two and a half years from March 2000 to October 2002, the “B” wave lasted five years, meaning that the “C” wave could last from two and a half years to four years if it conforms to normal parameters. Normal parameters are where the “C” wave is either equal in TIME to the “A” wave or 1.618 times (the next jump would be to 2.618 times but this is rare). At this moment I have labelled the DOW/S&P descent as three waves completing in March 2009 and that we are currently in wave 4 which will likely retrace 50% to the 1,050 level on the S&P by around late August this year. This is assuming my current wave count is correct. I have been told that Elliott Wave International believe that the March low was only the end of the first wave of “C” down which means that wave “C” will play out over the next 10 years or so!! Would Gold continue rising inversely to the market in those circumstances? Almost certainly not as the Gold Bull is already fairly mature at 10 years old and should only have a maximum four more years to complete.
In the middle of last year when I gave my long term Gold projections I thought that the Major Wave 2 correction would last into 2010 and take it back to $643 being the 50% retracement level. In the event, whilst Gold only retreated to $681 most other commodities had precipitous falls of around 75%, so I have assumed that Major wave 2 is complete and that we have started Major wave 3 up in October last year. Whilst this would be a short correction in TIME (7 months) by normal standards I have had to consider the fact that most other commodities saw corrections of 75% last year.
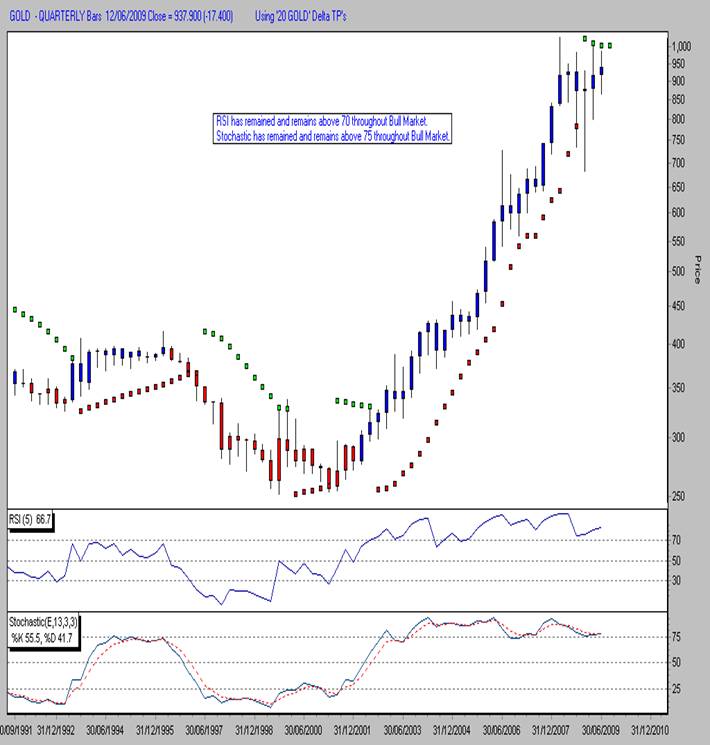
There are plenty of good fundamental reasons to be bullish on Gold, which I will come to later, but it is important to look at the charts to see what they are telling us. We will start with the quarterly chart to see the big picture as this encompasses the entire bull market to date. This is showing us that the bull market remains intact despite last year’s correction as the Relative Strength Indicator (RSI) has been above 70 since 2002 and remains above 70. Any breakdown below this level would warrant caution.
Also, if we look at the Stochastic, this has remained above the 75 level since 2002 also, even during the correction last year. One note of caution is with the Wilder Parabolic Indicator which went bearish in June last year and remains there until Gold moves above $1,012.
The next bullish evidence we have is on the Monthly Delta chart where the cycles are clearly mapped out for us by the Long Term Delta (LTD) points which have been very accurate with their time of arrival. LTD 3 low arrived in October last year and we are heading up to LTD 4 high which is not due until early next year. Whilst these indicators give us no guide to price, they are good at TIME.
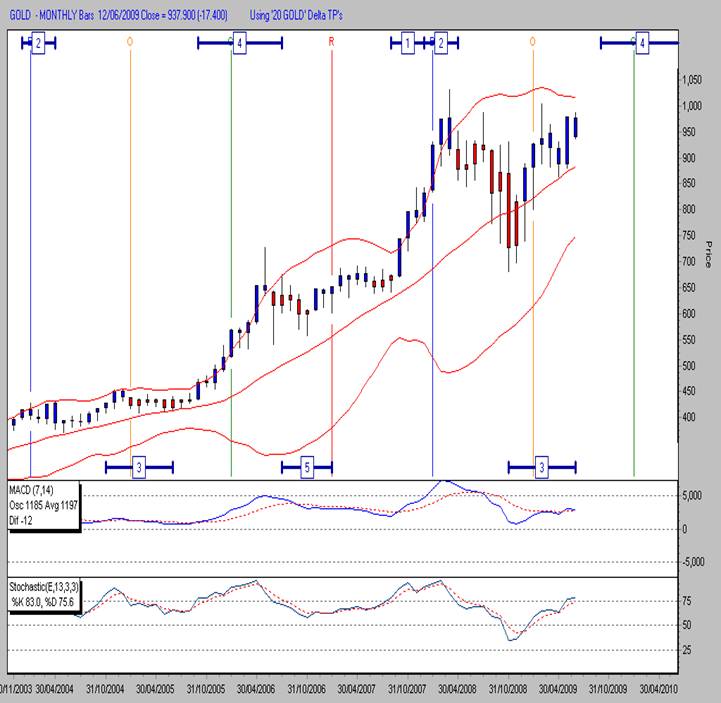
Looking at the indicators, the MACD has remained above 0 throughout the Bull market and remains so. The Stochastic has just reached 83 which allows for a rise of about $300 before looking overbought. The interesting indicator here is the Bollinger Bands which are starting to pinch together in anticipation of a big move in about a month.
Moving closer in to the weekly chart, we can see that the Medium Term Delta high arrived on time and that we are heading down to MTD 4 low
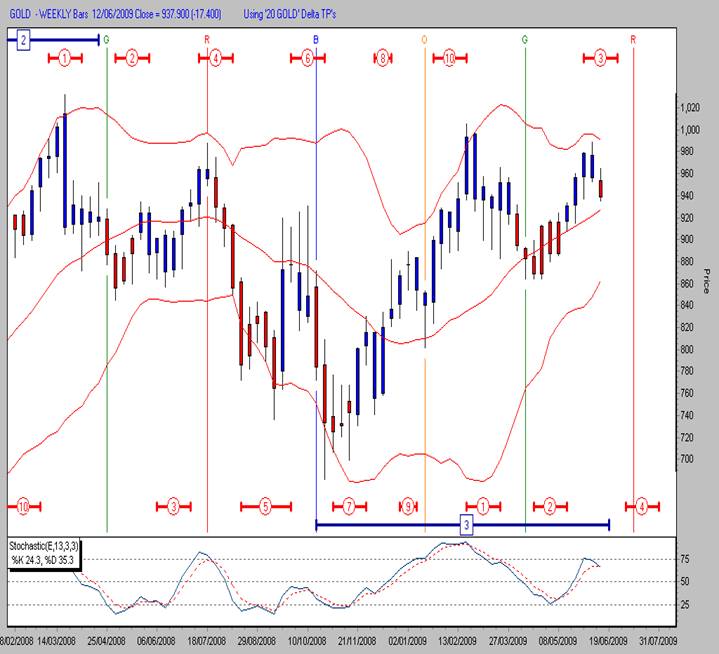
which is due 15th July, though I think it may well arrive a week early. The Stochastic reflects this and is pointing down, though it should not go below the 50 level. The top we have just had on 3rd June was also perfectly on time using the 16-week cycle first spotted by Martin Armstrong.
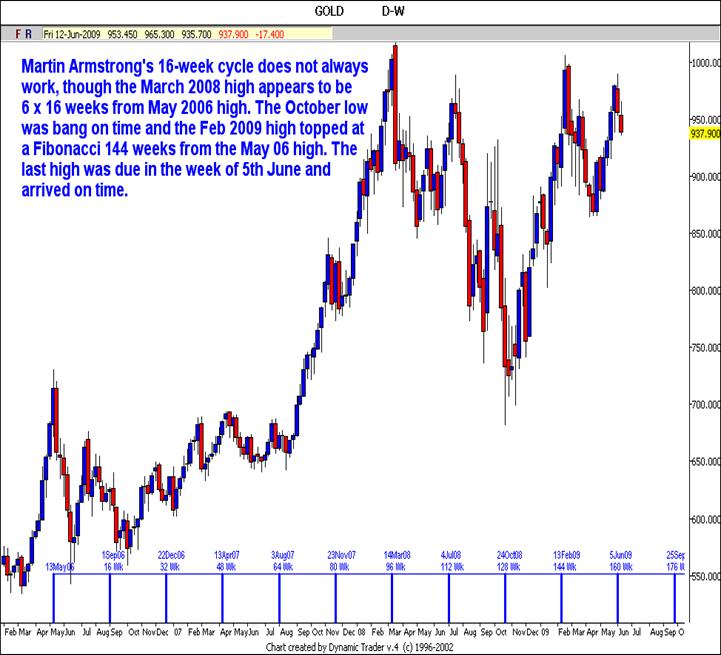
This shows the top due in the week ending 5th June with the next one due in the week ending 25th September.
If we look at PRICE targets, it appears that we are in a “c” wave of wave 2 (of Major Wave 3). With a “c” wave in a Bull market it will probably only retrace 61.8% of the “a” wave, which gives us a downside target of $902
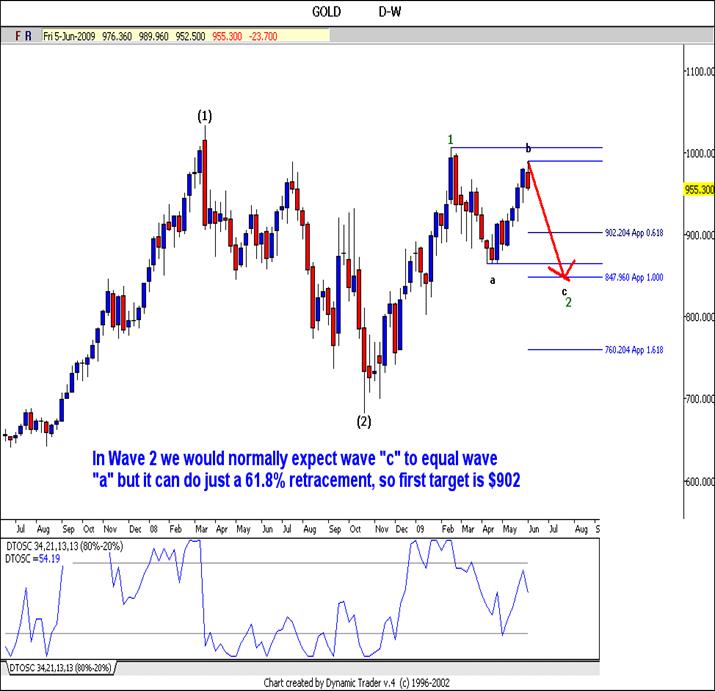
though the norm would be 100% for a “c” wave. Therefore if $902 is exceeded, we will be heading back to retest the 1980 closing high of $850 (with a target of $848).
One further piece of evidence that we have that may be pointing to the $850 target is the Commitment of Traders (COT) report. Last week’s data shows that the large Commercial traders have increased their short
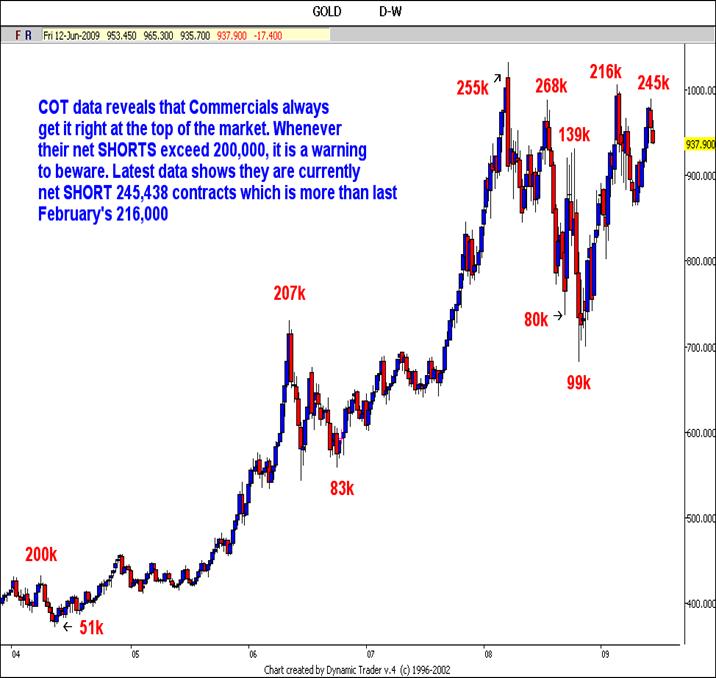
positions to 245,000 contracts. This data is always a week in arrears and this high level is normally a prelude to a reasonable correction as is shown on the chart above. So we have now looked at the long-term technical analysis that confirms that the Gold Bull is still intact and the medium term which shows that we have a few weeks of downside.
If we now zoom in on the short term for the traders amongst you, Gold should bottom in the next 24 hours, completing the “a” wave then bounce to around $960 in a “b” wave over the following week, before falling away into July to the $902 or possibly $850 levels.
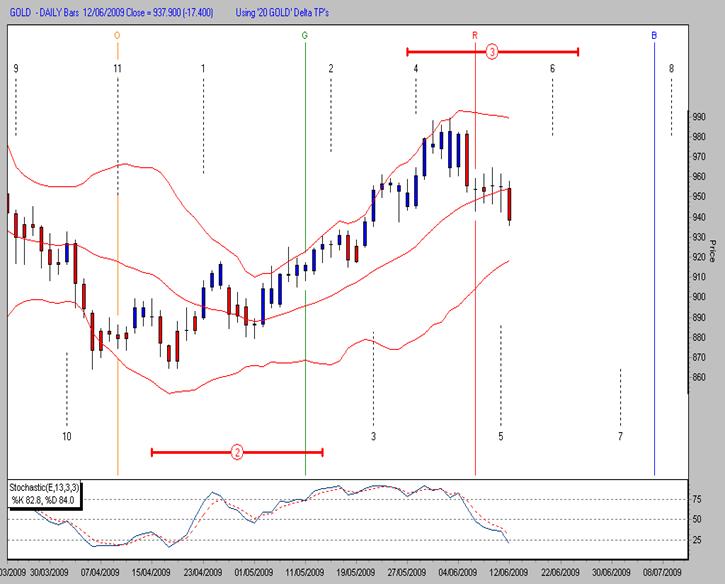
The Stochastic is confirming this with a current reading of just 23.
However, there is plenty of fundamental analysis that confirms the bullish tone as well.
We heard recently that the Chinese have doubled their gold reserves over the last 5 years but this still only represents just over 1% of their total reserves and they are on record as saying that they wish to increase these to around 10%. In addition, I reproduce below two recent stories that you may not have seen, that show why gold is retaining its lustre.
Getting real about gold
Robin Bromby | June 03, 2009
Article from: The Australian
America's third largest life insurer, Northwestern Mutual Life Insurance, has been in existence for 152 years.
It has never in all those years bought gold - until now.
The company has disclosed it recently invested around $US400 million to buy the yellow metal in the expectation that it was not only a prudent way to preserve its funds but also that the metal's price will rise significantly.
This is significant because here is a presumably conservatively-run company putting a good deal of faith in gold. We’re not just listening to the gold bugs anymore - their predictions are finally coming true. The rest of the world is now starting to buy the gold story.
Gold futures closed in New York last night at $US984/oz - that’s just $US14 off the magical $US1000/oz. This has been a fascinating rebound to watch; just a month or two ago, the weight of analyst opinion was that gold’s retreat from that $US1000 level (reached earlier in the year) would continue way down as low as $US750, some even predicting it would fall below $US700.
There was other bad news: gold imports by India and the Middle East - both regions where jewellery demand is the prime motivator for gold - has fallen significantly. But, instead, we have seen investors and hoarders around the world more than take up the slack.
Mind you, there is still plenty of scepticism. An overnight report from BNP Paribas in London argues that gold is rising because of US dollar weakness but this may not last. Really? The US has to borrow another $US1.8 trillion this year - how is that going to make the greenback stronger?
Anyway, back to the BNP report. It concludes that present comparative momentum analysis suggests that the current rise has the potential to persist for another four weeks, reaching perhaps as high as $US1095/oz. But then it would be seen as overbought - and prices would go into reverse.
We’ll see.
The privately owned hedge fund sponsor Paulson & Co. added over $3.7 billion in new gold positions during the first quarter of 2009,
increasing its total investment to $4.3 billion. About 46% of the equity portfolio is now allocated towards gold and gold stocks.
Not familiar with Paulson & Company, or founder John Paulson? You should be, and here’s why:
Paulson’s bet on the subprime mortgage debacle earned $3.7 billion in 2007.
The company made an estimated £606 million profit selling short British bank stocks in September 2008.
John Paulson ranked #2 on Alpha’s Highest-Earning Hedge Fund Managers of 2008.
Two of Paulson & Co.’s funds ranked #1 and #4 on Barron’s Top
100 Hedge Funds 2009 list.
≈
Aside from China doubling its reserves, Russia has been spending its surplus US Dollars on accumulating 200 tonnes of gold in the last year to strengthen its reserves and the Rouble. Venezuela and even Argentina have been buying gold to diversify away from the dollar. India and the Middle East have traditionally been hoarders of gold but now in the Persian Gulf, where US Dollars have been used for years for trading in shops (together with their own currencies on fixed exchange rates), they are now wanting to disconnect from the dollar and create a unified GCC currency with a basket of major currencies together with oil and gold. Even tiny Lebanon where I am now, and one of the smallest Middle Eastern countries, has got the 7th largest holding of gold reserves in the world.
In Dubai, they have created their own Commodities Exchange, they are launching their own gold ETF later this year and they are currently constructing the largest and safest repository for precious metals which will be attracting Middle Eastern gold back from traditional storage facilities in London and the US. This may well impact gold leasing to the market, leading to Commercial Traders being unable to short on the scale seen to date (or risk default).
Gold mining has been in decline since 2000 now at a time when demand for jewellery and industrial uses have increased. Demand has exceeded supply with very little investment demand, but that is picking up. Last year the US Mint and several major mints around the world had to stop production of gold investment coins as demand picked up and supply of gold together with minting capacity evaporated.
With the US running negative real interest rates, massive federal and trade deficits, and printing trillions of new dollars to rescue reckless financial institutions, there is only one way that the dollar can go and that is down, which will be good for all commodities (which are priced in US dollars), but especially for gold.
By Alistair Gilbert
ALISTAIR GILBERT has worked in the markets for over 30 years. He has worked as an institutional research analyst for a firm of stockbrokers where he got his grounding as a technical analyst. He has also worked as branch manager of a firm of stockbrokers managing private client portfolios and as a fund manager for a leading merchant bank. Alistair was also Managing Director of a Swiss Fund Management group with over $1 billion under management and developed the business extensively in the Middle East.
Alistair has now returned to his native England where he now specialises in TIME and PRICE analysis utilising Elliott Wave, DELTA and a range of technical indicators. I can be contacted via alistair@alistairgilbert.com
Disclaimer: The ideas expressed in this Report are the thoughts of Alistair Gilbert and represent part of the intricate process that he goes through before arriving at a trading decision and as such are like a trading diary. Alistair Gilbert is not an authorised investment adviser and as such none of his statements should be construed as investment advice. The value of investments can go up as well as down and trading is very high risk. Readers are advised to consult with their own investment advisers who may be better qualified to offer a trading strategy based on your own individual circumstances.
Alistair Gilbert Archive |
© 2005-2022 http://www.MarketOracle.co.uk - The Market Oracle is a FREE Daily Financial Markets Analysis & Forecasting online publication.