S&P 500 UltraShort ETF (SDS) at Channel Bottom
Stock-Markets / Stock Index Trading Jun 24, 2009 - 12:08 PM GMTBy: Mike_Paulenoff
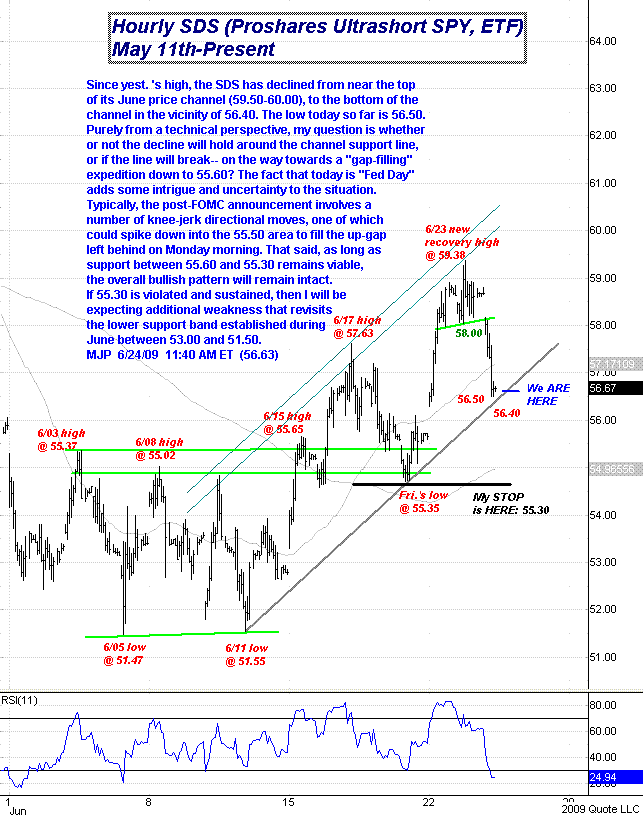
 Since yest. 's high, the UltraShort S&P 500 ProShares (NYSE: SDS) has declined from near the top of its June price channel (59.50-60.00), to the bottom of the channel in the vicinity of 56.40. The low today so far is 56.50. Purely from a technical perspective, my question is whether or not the decline will hold around the channel support line, or if the line will break-- on the way towards a "gap-filling" expedition down to 55.60? The fact that today is "Fed Day" adds some intrigue and uncertainty to the situation.
Typically, the post-FOMC announcement involves a number of knee-jerk directional moves, one of which could spike down into the 55.50 area to fill the up-gap left behind on Monday morning. That said, as long as support between 55.60 and 55.30 remains viable, the overall bullish pattern will remain intact. If 55.30 is violated and sustained, then I will be expecting additional weakness that revisits the lower support band established during June between 53.00 and 51.50. MJP 6/24/09 11:40 AM ET (56.63)

Sign up for a free 15-day trial to Mike's ETF Trading Diary today.
By Mike Paulenoff
Mike Paulenoff is author of the MPTrader.com (www.mptrader.com) , a real-time diary of Mike Paulenoff's trading ideas and technical chart analysis of
Exchange Traded Funds (ETFs) that track equity indices, metals, energy commodities, currencies, Treasuries, and other markets. It is for traders with a 3-30 day time horizon, who use the service for guidance on both specific trades as well as general market direction
© 2002-2009 MPTrader.com, an AdviceTrade publication. All rights reserved. Any publication, distribution, retransmission or reproduction of information or data contained on this Web site without written consent from MPTrader is prohibited. See our disclaimer.
Mike Paulenoff Archive |
© 2005-2022 http://www.MarketOracle.co.uk - The Market Oracle is a FREE Daily Financial Markets Analysis & Forecasting online publication.


