


Stock Market - June Swoon / Summer Rally
Stock-Markets / Elliott Wave Theory Jun 02, 2007 - 01:50 PM GMTBy: Joseph_Russo

"The Raging Bull" we spoke of a couple of weeks ago, appears to have taken up permanent residence across many sectors of the financial sphere. This bull has been relentless, cunning, and quite masterful in dealing with the plethora of participants who have been eagerly anticipating some type of correction – if not an outright crash!
After 11-weeks of nothing but blue sky, we suspect this bull may simply be growing bored of the dominance it imposes upon bears at will. Perhaps a couple of weeks respite in June ought to be a minimum at which this easily antagonized bull may once again become angered, electing to resume its deceptive charge with renewed fury.
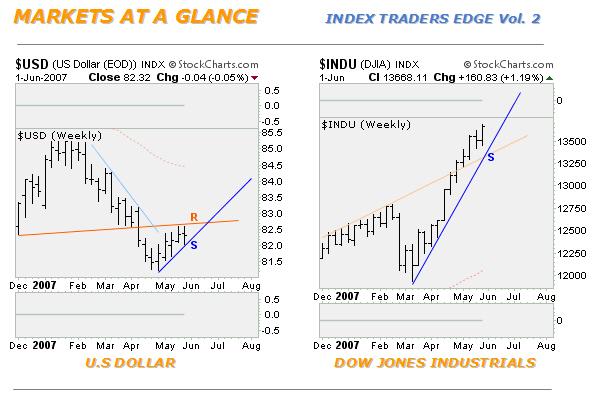
The Dollar has been on the rise for five-weeks since its low in April. The king-fiat's next hurdle is the 83.00 level - just above critical overhead resistance.
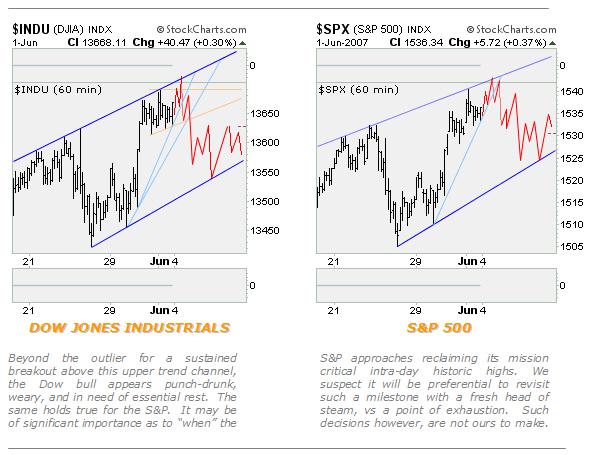
The Dow packs an overabundance of bullish-lift, which if threatened by a wide enough air pocket, could abruptly reverse the parabolic trend. We would consider anything less than that, minor turbulence.
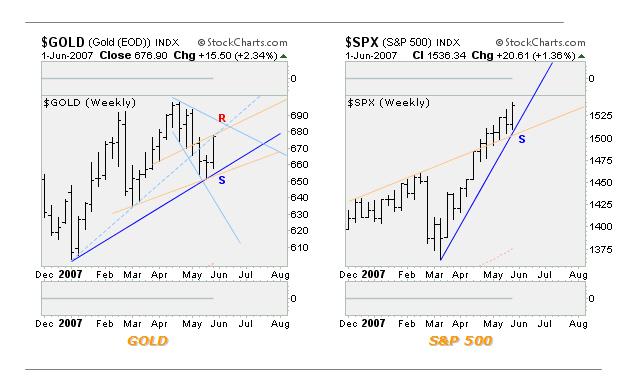
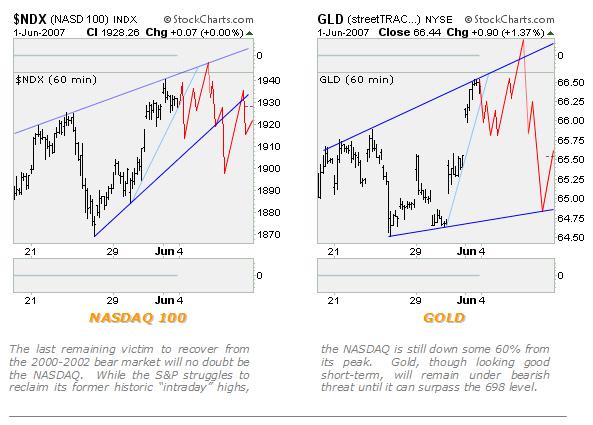
After a five-week pounding, gold has come back to life and is back-testing a key broken uptrend from 2007. For the next two weeks, key support is at $650, and resistance sits at the $690 level.
The S&P remains on a critical mission toward testing, and breaking out above its historic intra-day high at 1553.11. The timing at which the S&P elects encounter with such critical mass may prove pivotal.
March 5 – April 20
After a robust 9.75% rally from the March low, Swing-Trade guidance for Gold returned to a sell-side bias. Our bearish posture arrived courtesy of a sell-probe signaled against GLD's 68.73 high on April 20.
May 2 – May 7
By May 2, just seven sessions from our sell-side guidance, GLD printed an intraday low of 66.11 - down 3.77%. From that interim pivot low, in just two trading sessions - Gold exploded to the upside, challenging the resolve of those holding short – climbing back to 68.46, retracing nearly all of the short-side gains accrued over the previous seven sessions.
May 7 – May 17
The two-day price spike off the interim pivot low failed to produce any follow through. For the next 9 trading sessions GLD - pounded with sell orders - plummeted 5.46% before reaching an interim bottom at 64.72.
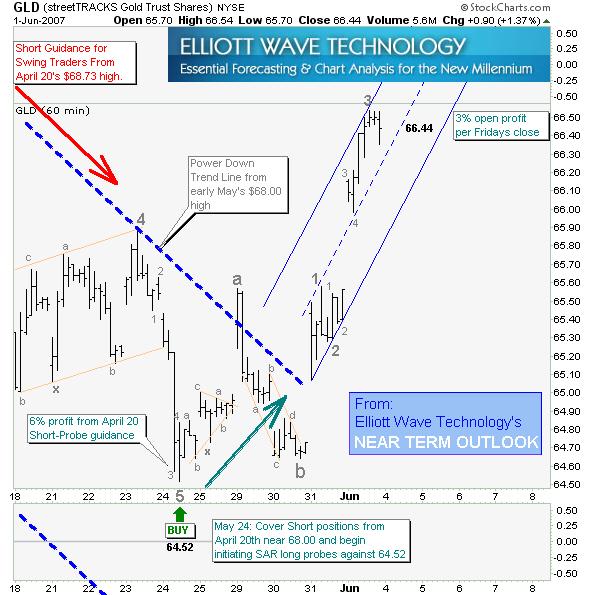
From Elliott Wave Technology's Near Term Outlook for the week ending June 1, 2007
May 17 – May 23
Upon stabilizing from the May 17 base at 64.72, GLD began inching its way back to the upside. Our studies suggested that the market was nearing a significant level of oversold, and ripe for a rally of merit. We quickly began warning sell-side swing-traders to prepare for imminent “buy-probes.” Price chopped higher for the next 5 sessions - touching an intraday high of 65.89 on May 23. That short-lived rally was corrective, and marked our smaller degree 4th-wave crest. Although we were turning near-term bullish on Gold, the market was still in a tight downward trend channel, and was telegraphing the potential for another marginal 5th-wave low prior to setting a tradable bottom.
May 24 – June 1
While progressing through the 4th-wave high, we had drawn a lower boundary trendline illustrating a bearish flag pattern that was engulfing the triple-three corrective rally. Further, we projected an additional .77-cent decline would be likely if that boundary were to fail. As if on queue, trade on May 24 broke down sharply below that boundary - printing GLD's intraday low of 64.52, down .79-cents on the day. Known in well in advance, our pending buy-probes confirmed at 64.52 - just .20-cents, or a marginal .3% under the May 17 low of 64.72. On May 29, after a gap-up out of a small corrective coil, the sudden rally faded just as quickly as it arrived, then headed straight back down toward a near re-test of its lows. By sessions-end, GLD reversed higher to close the month back above the power down trendline. By the end of trade on Friday June 1, another gap-up rally took root, and closed the first session of June sharply higher at 66.44, up 3% from the May 24 low.
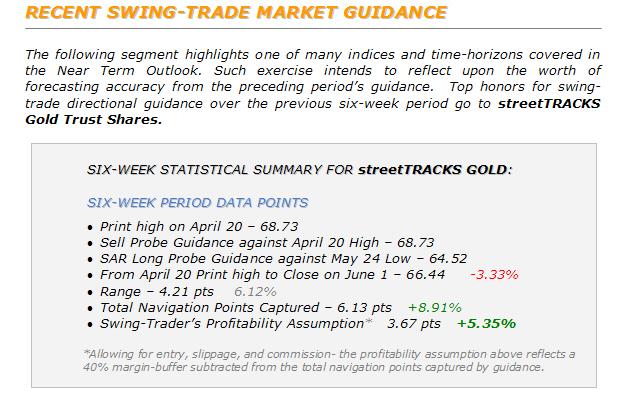
The Near Term Outlook delivers unrivaled short and long-term forecasting guidance for the U.S Dollar, Dow, SPX, Gold, HUI, and NDX.
The concise, impartial market guidance present throughout this publication provides clear targets, triggers, and variant parameters from which active traders can successfully construct low-risk trading strategies. The immediate and long-term rewards in adopting such guidance as part of one's trading arsenal are measurable.
We remind readers that the rigors and discipline we employ in delivering such guidance is by no means arcane. Our methodology is fully transparent, and clearly translated, providing a lifelong benefit of advanced trading skills to each of our clients. We do not predict prices, nor are we ever tied to a fixed bias or singular perception; instead, we adapt to the price action as it unfolds. As evidenced in reviewing our prior period's guidance for GLD - streetTRACKS gold, the competitive edge is most notable.
Trade Better / Invest Smarter...
By Joseph Russo
Chief Editor and Technical Analyst
Elliott Wave Technology
Copyright © 2007 Elliott Wave Technology. All Rights Reserved.
Joseph Russo, presently the Publisher and Chief Market analyst for Elliott Wave Technology, has been studying Elliott Wave Theory, and the Technical Analysis of Financial Markets since 1991 and currently maintains active member status in the "Market Technicians Association." Joe continues to expand his body of knowledge through the MTA's accredited CMT program.
© 2005-2022 http://www.MarketOracle.co.uk - The Market Oracle is a FREE Daily Financial Markets Analysis & Forecasting online publication.