


Inflationary Pressures and the MAE Faber Investment Strategy
Stock-Markets / Inflation Jun 30, 2009 - 04:43 AM GMTBy: Guy_Lerner

 William Hester, CFA is a Senior Financial Analyst with the Hussman Funds, and he has written an interesting article that attempts to answer the question: "does the current economic backdrop yet have the characteristics that usually coincide with the end of secular bear markets?"
I have sought answers to a similar question, and this has led to the development of the "next big thing" indicator, which attempts to quantify those technical characteristics seen at market bottoms just prior to secular trend changes. I have written enough in these pages about the proper launching pad and having tailwinds not headwinds.
I believe Hester's real insight is the link between valuations and investors willingness to pay for those valuations. If investors are certain about the future (albeit based upon recent past experiences), then they are willing to pay up for equities. Investors believe the good times will continue, and this is how we get bubbles. If investors are uncertain about the future, then they need lower valuations. Investors perceive that the bad times will continue, and within this period of uncertainty, valuations are driven lower and markets bottom.
To measure investors' "comfort level" with the economy, Hester uses the volatility of inflation. In his own words, Hester states:
It's not only the level of volatility and uncertainty in the economy that matters to investors, but also the trend and the persistence in this uncertainty. Shrinking amounts of volatility in the economy creates an environment where investors are willing to pay higher and higher multiples for stocks, while growing uncertainty brings lower and lower multiples.
One of themes that appears to be on investors' minds is inflation. Even though inflation, as measured by year over year CPI, is low, investors perceive inflation to be a threat as we have rising deficits, a government willing to "bailout" all those who fail, and a government willing to avoid today's pain and "kick the can" down the road, and world central banks willing to devalue their currencies to gain a competitive advantage.
To assess inflation, I have developed a composite indicator that looks at the trends in gold, crude oil, and yields on the 10 year Treasury. When these trends are strong and rising as they are now, equities tend to under perform. Previously, I had shown this in the article entitled, "More Headwinds To Worry About". Going back to 1985, when these trends were strong, equities underperformed - even during the bull market of the 1990's and particularly from 2004 onward.
But let's get back to Hester. He states that "it's important to note that during the current secular bear market, the volatility of inflation has mostly been well contained." The value is less than those seen at past bear market bottoms, but the trend is rising.
"Valuations going forward may show their typical sensitivity to economic uncertainty, and for this reason, the change in the slope of the volatility of inflation over the last two years is troublesome. The level of inflation volatility is still low, relative to the peaks reached during prior secular bear markets. If the level of inflation volatility continues to increase, it will become more difficult to argue that the secular bear market has come to an end."
To summarize by answering his own question from above -does the current economic backdrop yet have the characteristics that usually coincide with the end of secular bear markets? - Hester states:
"...secular bear markets of last century shared three characteristics. They each lasted for more than 15 years, they each ended at extremely attractive levels of valuation (generally about 7-9 times trailing 10-year earnings), and , and they each endured many years of growing volatility in output and inflation, which eventually created the mindset for investors to price stocks at attractive levels of valuation. The current secular bear market can claim none of these characteristics yet."
So how can we use this information? Inflation concerns are legitimate, and the uncertainty of inflation is a headwind. How much so? Let's meld our inflation indicator with the Faber strategy. We will use our inflation indicator as a filter in that no new positions will be established or current positions will be exited when the inflation indicator is in the high inflation zone as it is now. See figure 1 a monthly graph of the S&P500 with our inflation indicator in the lower panel. One note, in the original articles on this indicator, I utilized the trends in crude oil, gold, and yields on the 10 year Treasury bond to construct our indicator. In this article, I replaced the crude oil data with data from the Reuters - CRB Index as this data set goes back to 1971; doing this does not affect the results of this study.
Figure 1. Inflation Trends/ monthly
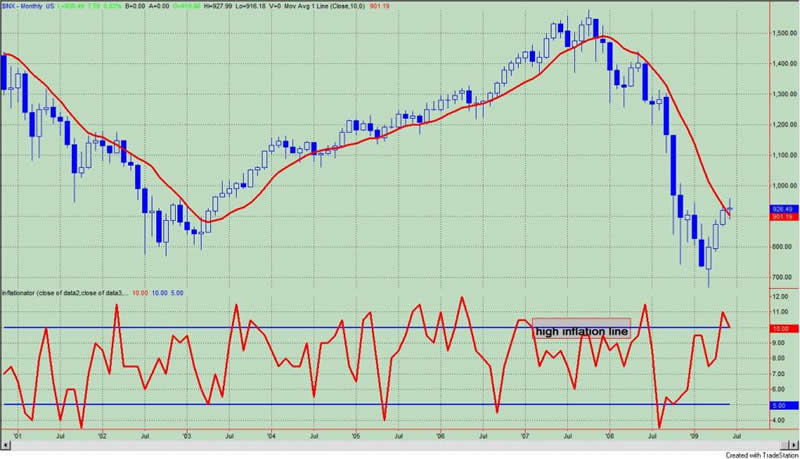
Let's take a brief look at the Faber strategy. If you remember, the Faber strategy bought and sold the S&P500 on monthly closes above (and below) the simple 10 month moving average. The Faber strategy benefits more from its avoidance of risk than from its ability to pick a market bottom. Since 1975, the Faber strategy generated 1376 S&P500 points; buy and hold yielded 850 points. There were 24 trades of which 63% were profitable; the time in the market was 61%. Maximum equity curve draw down was 17%. The Rina Index, which is a measure of trade efficiency, is 147.
The maximum adverse excursion (MAE) graph is shown in figure 2. MAE assesses each trade from the strategy and determines how much a trade had to lose before being closed out for a winner or loser. For example, look at the caret with the blue box around it. This one trade lost 6% percent (x-axis) before being closed out for a 20% winner (y-axis). We know this was a winning trade because it is a green caret.
Figure 2. MAE Faber Strategy
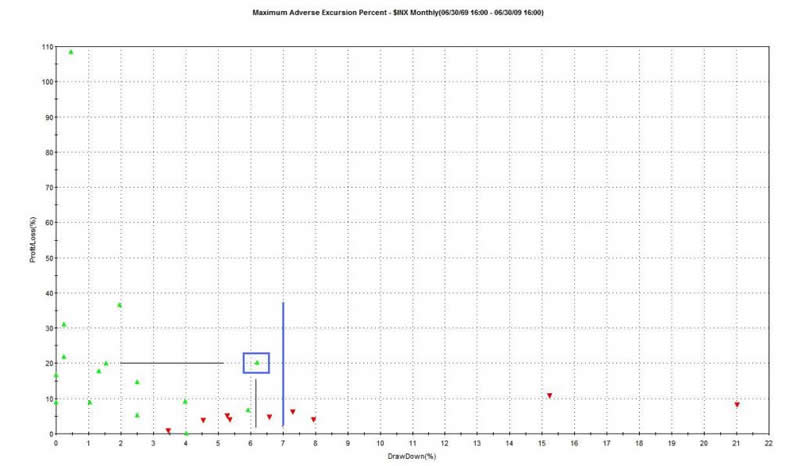
Of the 24 trades, 20 had an MAE less than 7%; this is to the left of the blue vertical line. Of the 4 trades with MAE's greater than 7%, all those trades didn't recover and were closed out as losers; this is to the right of the blue line.
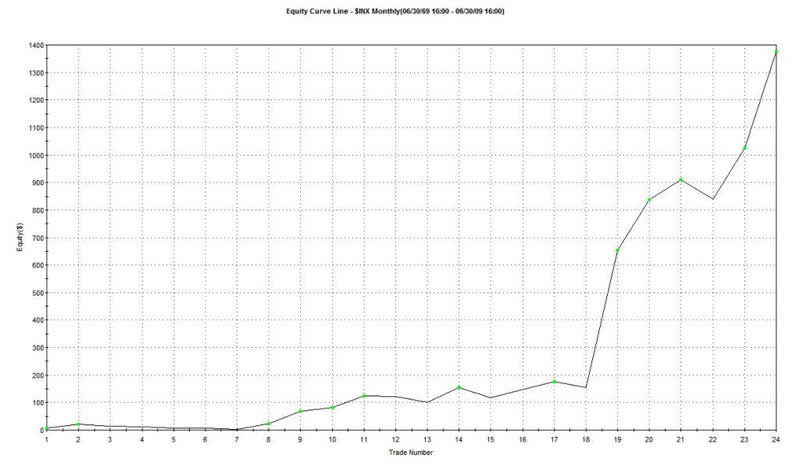
Figure 3 is the equity curve from this strategy.
Figure 3. Equity Curve
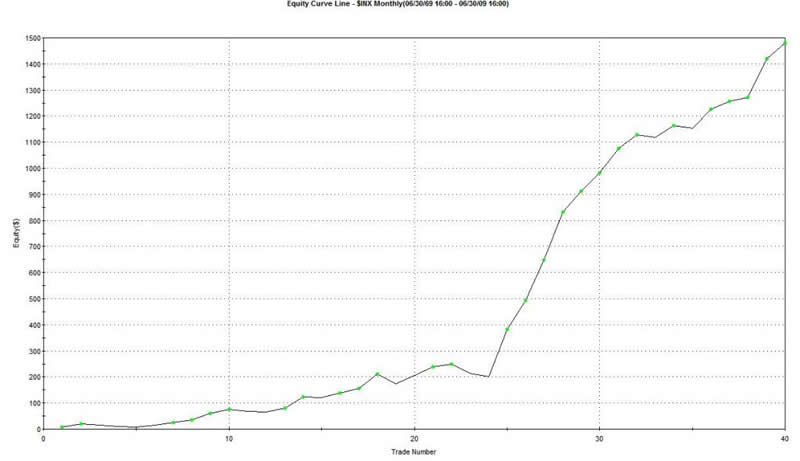
Now let's use the inflation indicator as a filter for the Faber strategy. In this case, we will only be in the market (i.e., S&P500) when prices are above the simple 10 month moving average and when the inflation indicator is below the high inflation line. Since 1975, this strategy yields 1479 S&P500 points; as before, buy and hold netted 850 points. There were 40 trades of which 73% were profitable. The time in the market was 52%. Maximum equity curve draw down was 16%. With greater profits, less draw down, and less time in the market, the trade efficiency or RINA index is 50% higher at 218.
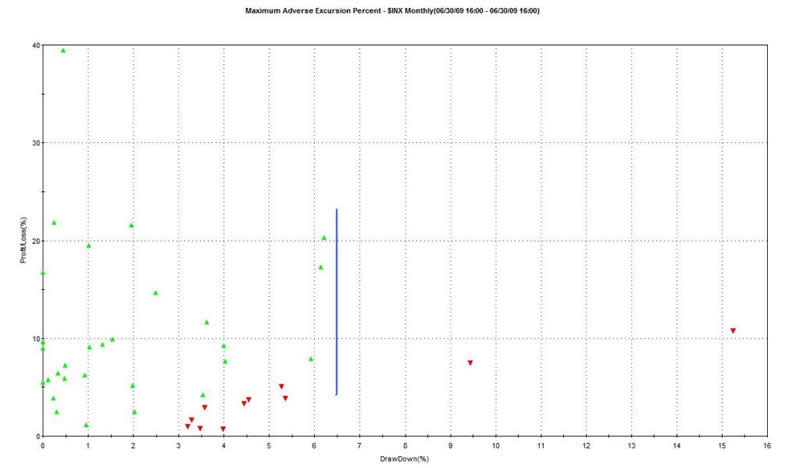
The MAE graph for this strategy is shown in figure 4. Of the 40 trades, 38 had MAE's less than 6.5%; this is to the left of the blue vertical line. Only two trades had MAE's greater than 6.5%, and both of these went on to be losers.
Figure 4. MAE Graph
The equity curve for this strategy is shown in figure5.
Figure 5. Equity Curve
Inflationary pressures are a legitimate concern. Hester's notion that the characteristics of a true bull market bottom have not been met are intuitive and insightful. From my perspective, the Faber strategy performs more efficiently when we avoid being in the market when inflation pressures -real or perceived- are high, as determined by our inflation indicator, which assesses trends in commodities, gold, and yields on the 10 year Treasury.
This is the most compelling evidence that suggests the impending signal from the Faber strategy will be a false signal. Avoidance of equities in times of uncertainty -as measured by strong trends in gold, commodities, and yields on the 10 year Treasury bonds - is unlikely to lead to under performance.
By Guy Lerner
http://thetechnicaltakedotcom.blogspot.com/
Guy M. Lerner, MD is the founder of ARL Advisers, LLC and managing partner of ARL Investment Partners, L.P. Dr. Lerner utilizes a research driven approach to determine those factors which lead to sustainable moves in the markets. He has developed many proprietary tools and trading models in his quest to outperform. Over the past four years, Lerner has shared his innovative approach with the readers of RealMoney.com and TheStreet.com as a featured columnist. He has been a regular guest on the Money Man Radio Show, DEX-TV, routinely published in the some of the most widely-read financial publications and has been a marquee speaker at financial seminars around the world.
© 2009 Copyright Guy Lerner - All Rights Reserved
Disclaimer: The above is a matter of opinion provided for general information purposes only and is not intended as investment advice. Information and analysis above are derived from sources and utilising methods believed to be reliable, but we cannot accept responsibility for any losses you may incur as a result of this analysis. Individuals should consult with their personal financial advisors.
Guy Lerner Archive |
© 2005-2022 http://www.MarketOracle.co.uk - The Market Oracle is a FREE Daily Financial Markets Analysis & Forecasting online publication.