


Stock Market and Dollar Upward Wedge Patterns - Signs of the times
Stock-Markets / CRB Index Jul 02, 2009 - 05:34 AM GMTBy: Garry_Abeshouse

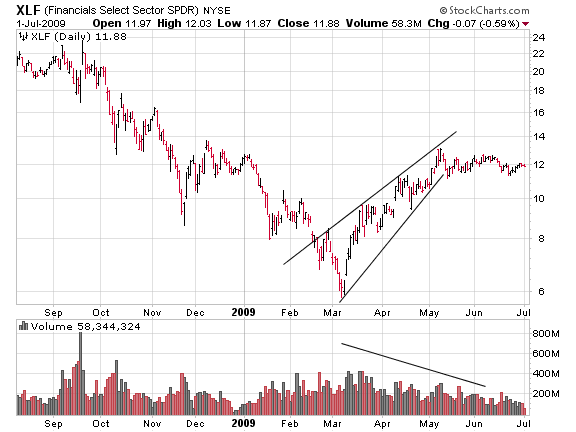
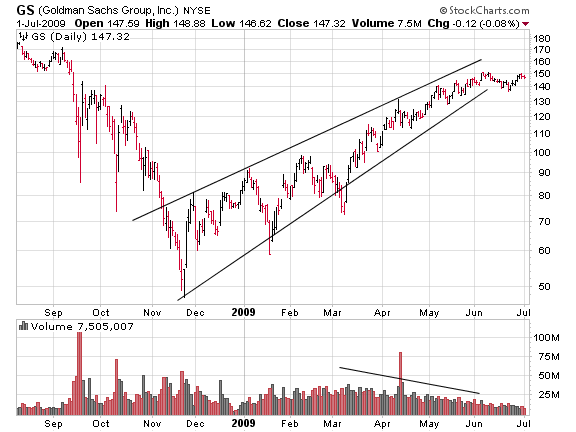
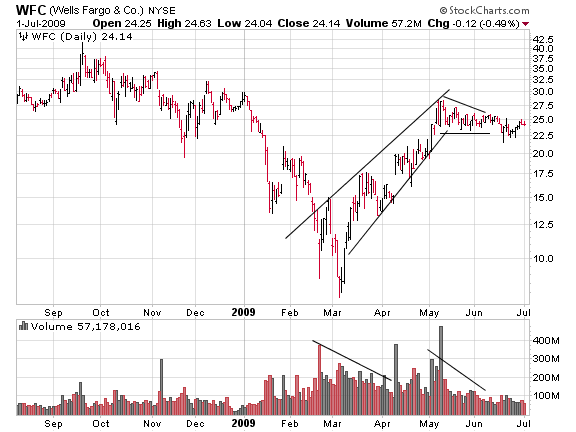
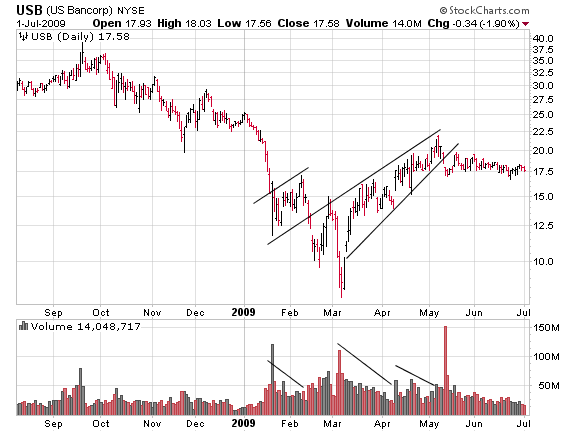
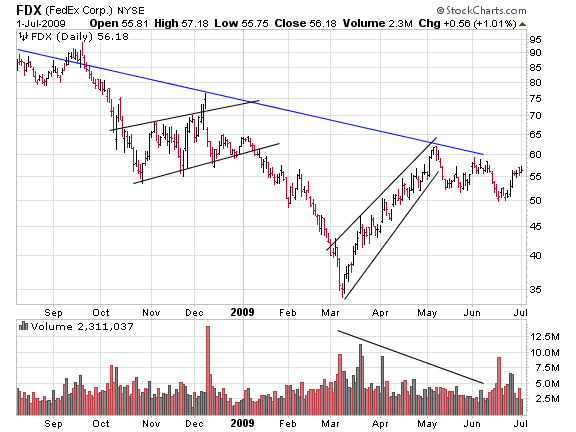
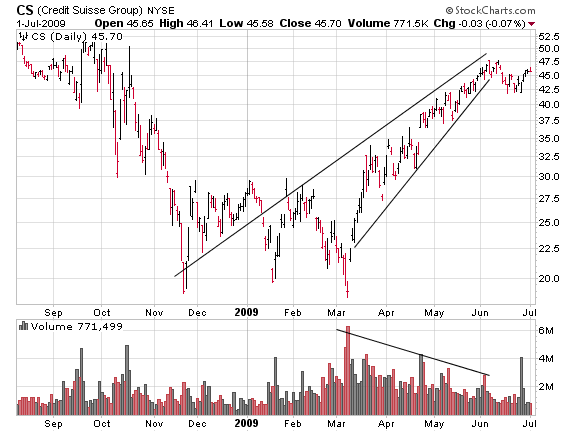
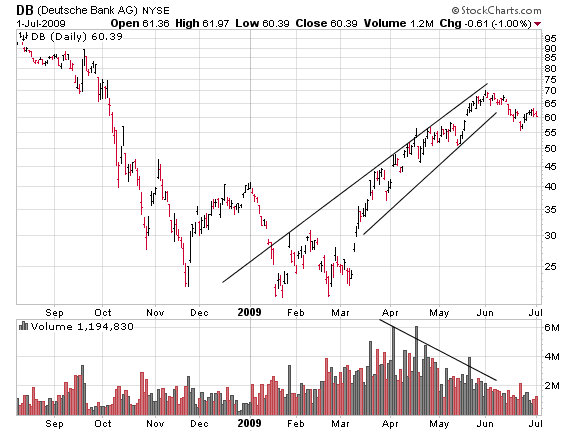
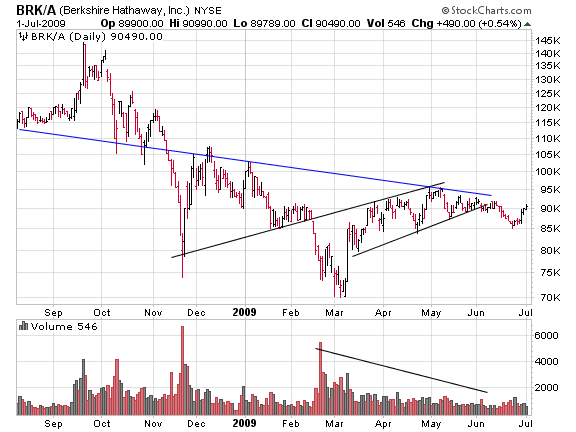
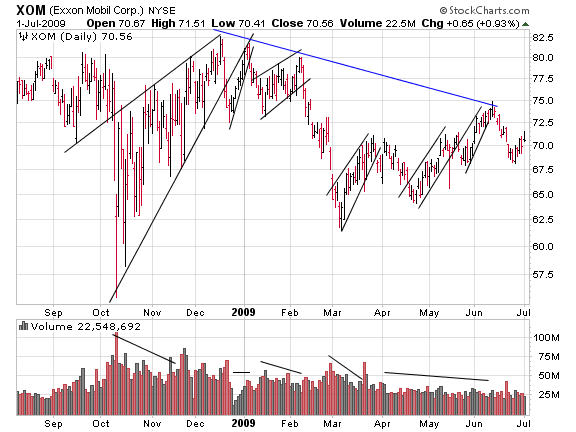
 Over the last 12 months, the USD and now US equities, have formed bearish upward wedge formations on the charts. Upward wedges are usually well defined patterns showing weakening upward momentum, hence the shape. These patterns are known to be very common in stocks during bear markets and were especially so during the period 1929 to 1932.
They are also associated with declining volume profiles – see chart examples below.
Technically speaking, roughly comparable bullish rallies to now, were experienced in the Australian mining market between the second half of 1971 and the end of 1972, in the USA on the Dow in 1930 and the on Nasdaq 100 during the Tech Bust in 2001. By saying, this I do not suggest that future moves will exactly replicate past ones. But what I do suggest is that as before, once the uptrends of these wedges are broken, there is a high probability that if lows are successfully tested, the bear market will resume.
US composite indexes are currently testing important resistance areas and trend lines and I expect that the persistence of these upward wedge formations now, as in the past, will be a continuing sign that the Bear is still strong. The rally has not given a proper sell signal yet and is still trying to squeeze as much as possible out of the rise.
Robert Edwards and John Magee wrote the first (and still one of the best) major text books on Technical Analysis. This book, “Technical Analysis of Stock Trends”, was based upon their experiences in the US stock market from the late 1920’s to 1950 and beyond.
They observed more charts during protracted bear markets than anyone since – due to the fact that since 1942 the US has been in bull mode most of the time. Most of the bearish patterns displayed in this book are from the period 1929 to 1947 – and is one reason why this book is unique.
This is what Edwards and Magee had to say (in part) about Upward Wedge chart patterns as they appear on Bar charts:
“In a Rising Wedge there is no evident barrier to supply to be vaulted, but rather a gradual petering out of investment interest. Prices advance, but each new up wave is feebler than the last. Finally demand fails entirely and the trend reverses. Thus a Rising Wedge typifies a situation which is growing progressively weaker in the technical sense. The converging boundary lines focus on a point near where the advance will halt and reaction set in.”
“Trading volume in a Wedge tends to diminish gradually as prices move up towards the apex of the Wedge.”
“Most true Wedges are too short lived (seldom longer than 3 months) to take on recognizable definition on a monthly chart, but they may be spotted on (dailies and) weeklies.”
“As a final note, we might add that the rising wedge is quite a characteristic pattern for Bear Market rallies. It is so typical in fact, that frequent appearance of Wedges at a time when, after an extensive decline, there is some question as to whether a new Bull trend is in the making, may be taken as evidence that the Primary (Bear) trend is still down.”
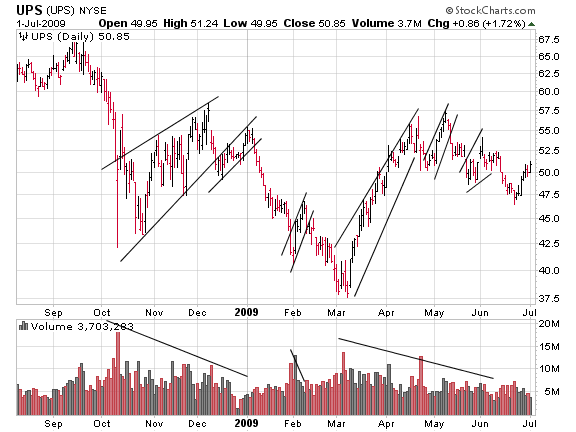
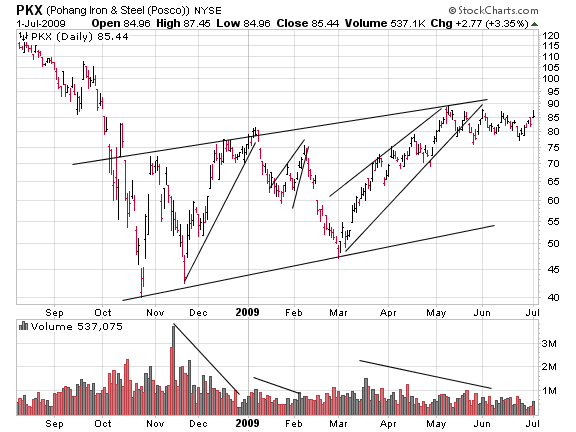
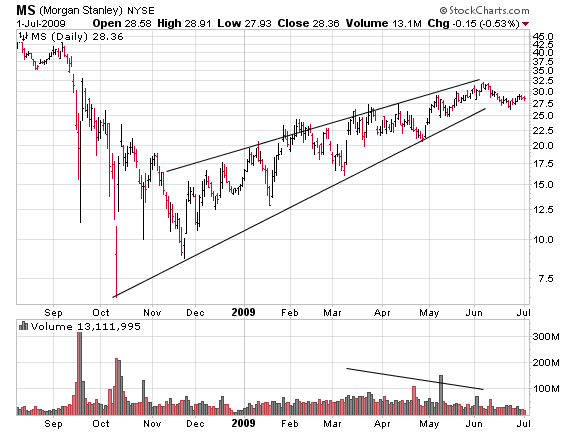
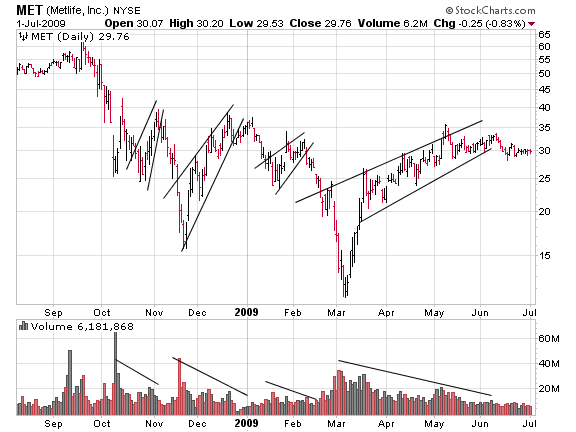
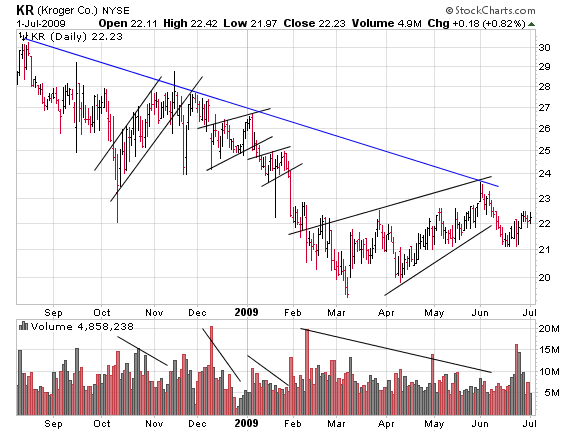
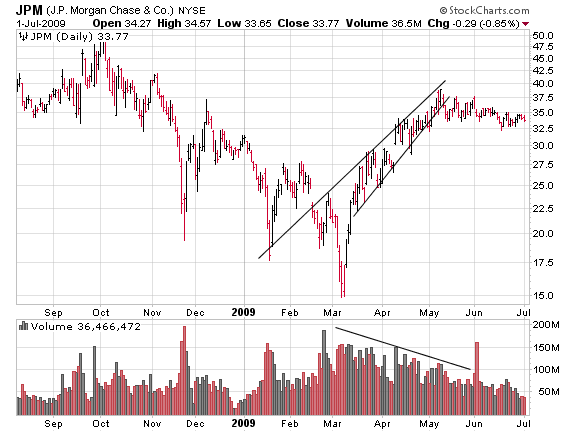
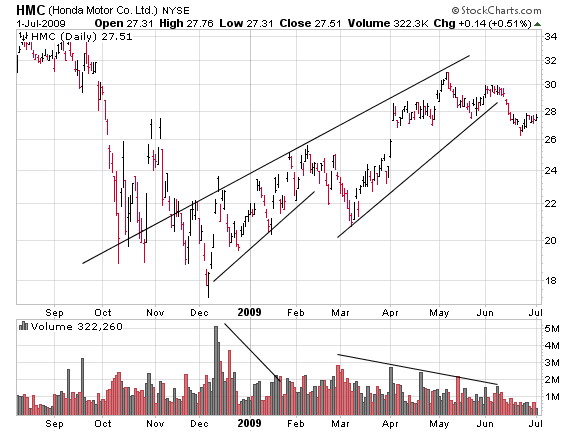
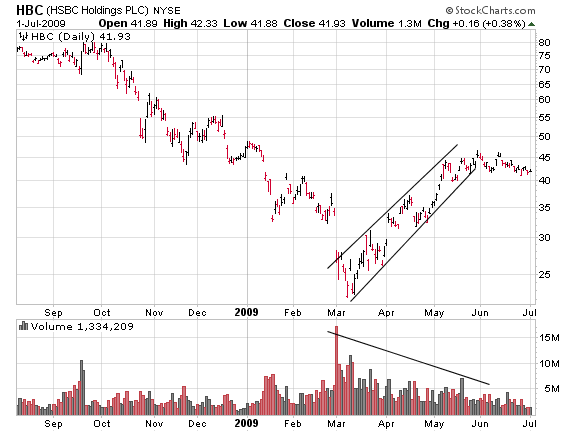
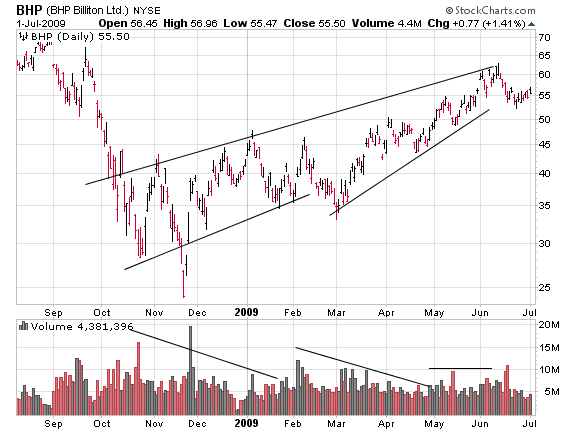
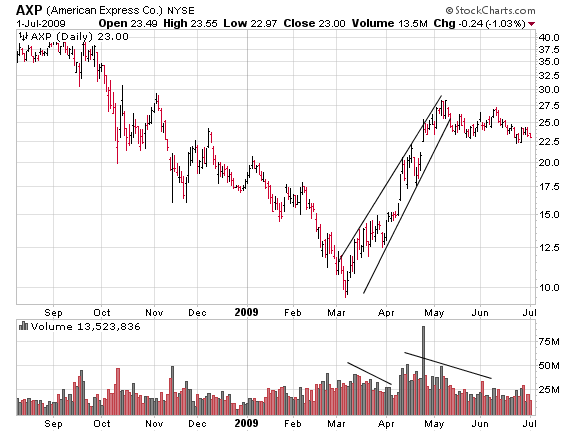
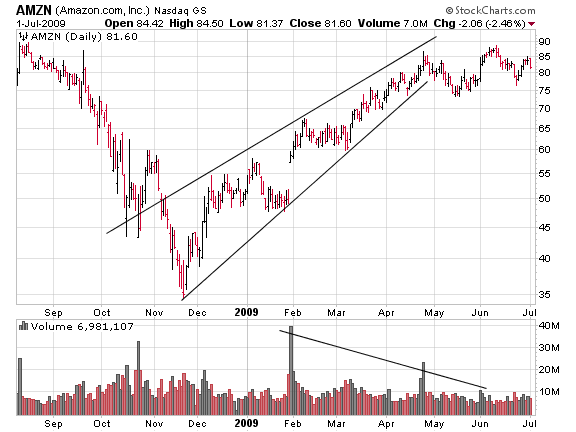
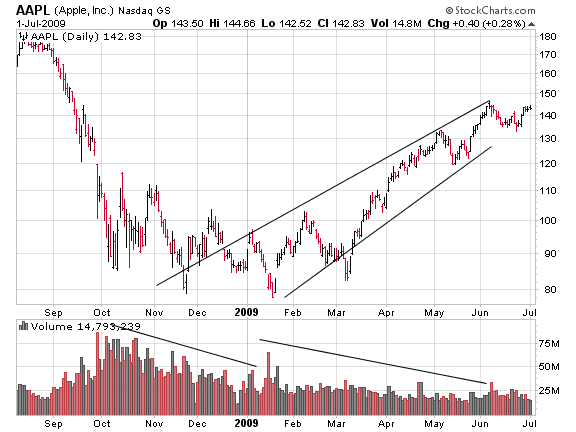
Below you will find charts all showing very well defined Upward Wedge chart patterns. They are so prevalent at the moment I feel they cannot be ignored.
On June 8th in one of my newsletters, I illustrated charts showing more than 50 of these patterns. As far as I know no one has ever done a technical study like this before, showing so many charts with the same pattern at possibly such a highly critical turning point in the market.
In this Charting Perspective I have included 21 of these charts, updated to July 1st 2009. They are all dailies, in no particular order and apart from a couple of resistance line additions have not been altered.
Garry Abeshouse
Technical Analyst.
Sydney
Australia
I have been practicing Technical Analysis since 1969, learning the hard way during the Australian Mining Boom. I was Head Chartist with Bain & Co, (now Deutsch Bank)in the mid 1970's and am now working freelance. I am currently writing a series of articles for the international "Your Trading Edge" magazine entitled "Market Cycles and Technical Analysis".
I have always specialised in medium to long term market strategies and after discovering the excellent Point & Figure Charts from Stockcharts.com in mid 2008, have concentrated on this style of charting ever since.
© 2005-2022 http://www.MarketOracle.co.uk - The Market Oracle is a FREE Daily Financial Markets Analysis & Forecasting online publication.