Crude Oil Points Lower
Commodities / Crude Oil Jul 06, 2009 - 12:45 PM GMTBy: Mike_Paulenoff
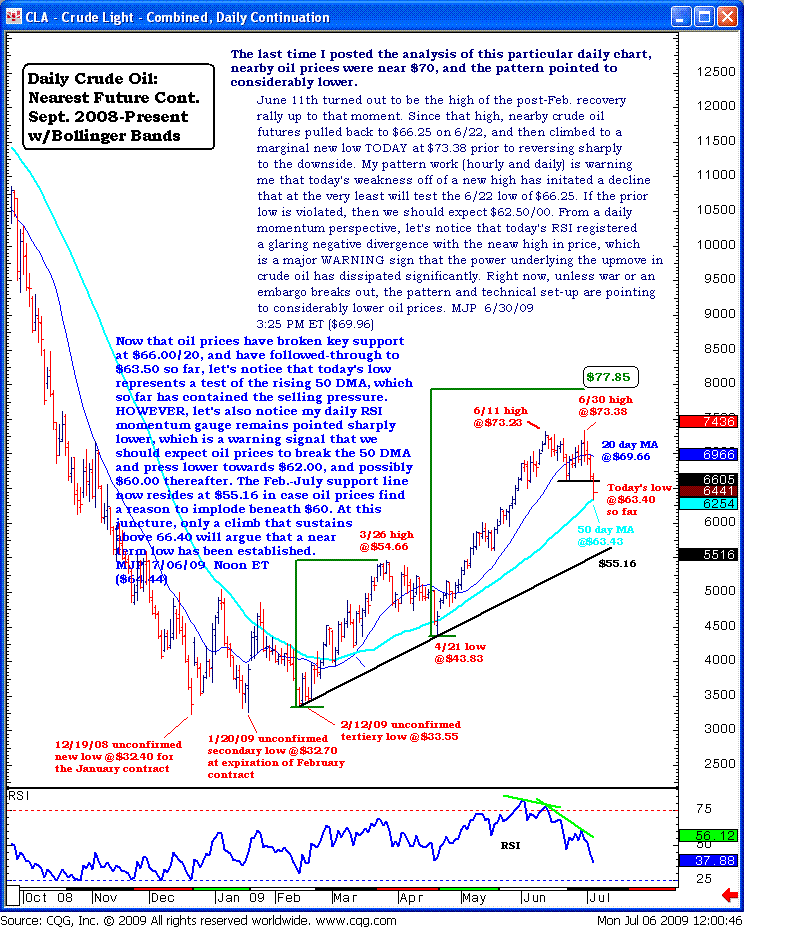
 Now that oil prices have broken key support at $66.00/20 and have followed-through to $63.50 so far, let’s notice that today’s low represents a test of the rising 50-day moving average, which so far has contained the selling pressure. However, let’s also notice that my daily RSI momentum gauge remains pointed sharply lower, which is a warning signal that we should expect oil prices to break the 50 DMA and press lower towards $62.00 and possibly $60.00 thereafter.
The Feb-Jul support line now resides at $55.16 in case oil prices find a reason to implode beneath $60. At this juncture, only a climb that sustains above $66.40 will argue that a near-term low has been established. One instrument we follow for playing oil’s downside is the PowerShares DB Double Short Oil ETN (NYSE: DTO), whose intermediate-term measured target zone remains 100-105.

Sign up for a free 15-day trial to Mike's ETF Trading Diary today.
By Mike Paulenoff
Mike Paulenoff is author of the MPTrader.com (www.mptrader.com) , a real-time diary of Mike Paulenoff's trading ideas and technical chart analysis of
Exchange Traded Funds (ETFs) that track equity indices, metals, energy commodities, currencies, Treasuries, and other markets. It is for traders with a 3-30 day time horizon, who use the service for guidance on both specific trades as well as general market direction
© 2002-2009 MPTrader.com, an AdviceTrade publication. All rights reserved. Any publication, distribution, retransmission or reproduction of information or data contained on this Web site without written consent from MPTrader is prohibited. See our disclaimer.
Mike Paulenoff Archive |
© 2005-2022 http://www.MarketOracle.co.uk - The Market Oracle is a FREE Daily Financial Markets Analysis & Forecasting online publication.


