


Where Are We in This Stocks Bear Market?
Stock-Markets / Stocks Bear Market Jul 07, 2009 - 03:13 PM GMTBy: Adam_Brochert

 The short answer: somewhere around halfway through it. The long answer follows. The price to earnings ratio for the S&P 500 is currently greater than 100 and earnings are not coming back strong in the next few quarters, I can assure you. If you think so, stop reading here and go back to CNBC to get your analysis. Cramer has a hot stock tip for you right now!
This is not a regular bear market. This is a credit contraction bear market like the one in the 1929-1932 time frame or the Japanese 1990-1992 bear market. Those who go on and on about money printing fail to realize that most of the money printing over the last decade didn’t come from the private, for profit federal reserve corporation or the government. It came from bankstas and Wall Street leveraging the printed money via loans and other credit instruments.
In a sense, we’ve already had a hyperinflation in asset prices and now asset price collapse is causing a deflationary storm before the next inflation can begin. If you wipe out half of Wall Street, leave the other half begging for money at the government teat, and also wipe out the banking system, you get asset price deflation and credit contraction. Yes, fiscal and monetary “stimulus” will eventually cause some inflation in asset prices, but a deflationary collapse is in progress and won’t be stopped by incompetent apparatchiks. And the private non-government agency known as the federal reserve corporation will buy as many assets as it can for pennies on the dollar before the next inflation begins (which they will profit from, believe me).
The inflation versus deflation debate rages on and I am no expert compared to some of the commentators out there. However, regardless of what is happening at the pure monetary level, asset prices will continue to collapse. Price changes are not inflation or deflation, I understand. But when you’re making investment decisions, aren’t you trying to guess whether asset prices (e.g., stocks, commodities) will rise or fall rather than whether or not we are in deflation or inflation?
If I am wrong and monetary purists are right that we are in inflation because money creation is net positive right now, I don’t care. Because what I do know is that the stock market is going much lower and commodities are going to get crushed. Real estate is dead for the next decade. Gold, the ultimate form of money and a good deflation hedge, and fiat cash (better pick the right country’s currency, though) are the only places to hide if you don’t like to short the markets.
Anyway, this cyclical bear market has a long way to go. I have two fractal-like patterns that I am following right now as a general “road map” to this bear market, although these are just rough guidelines. The most relevant in my opinion, is the stock index of the last country that went through a real estate and stock market collapse due to asset price deflation: Japan. The Japanese bear market from 1990-1992 is shown below in chart form with where I think we are in a relative sense using this template as a guide for what’s in store for the US stock market:
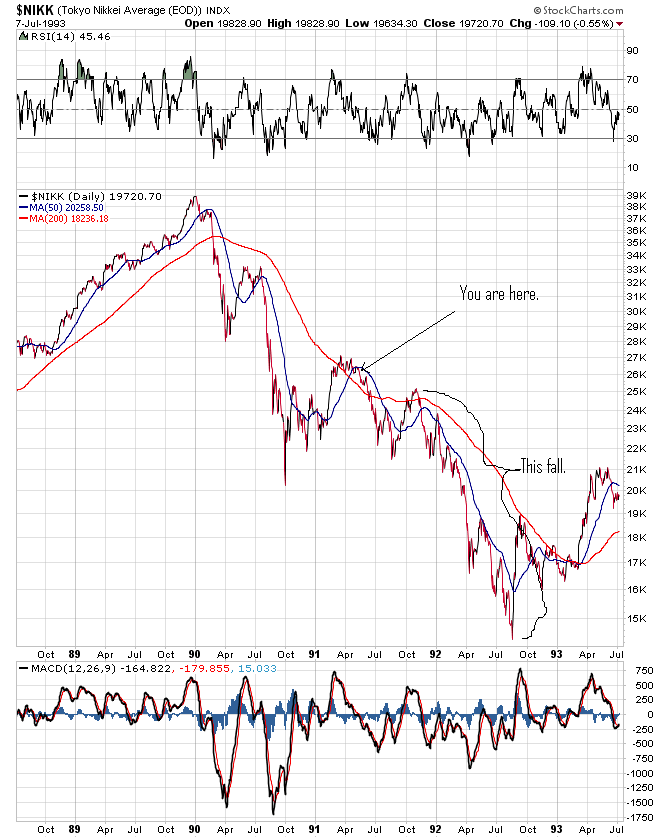
We have started the first leg down of the final big leg down, but nothing moves in a straight line. A re-test of the fall ’08 and/or March ’09 lows is in order, followed by a bounce into the early fall, followed by more devastating downward moves that will likely last into early-to-mid 2010. Note the duration of the bear market at roughly 2.5 years.
Another potential crude template (off in magnitude and timing) is the Panic of 1907. The following chart sourced from www.thechartstore.com with my scribbles on it:
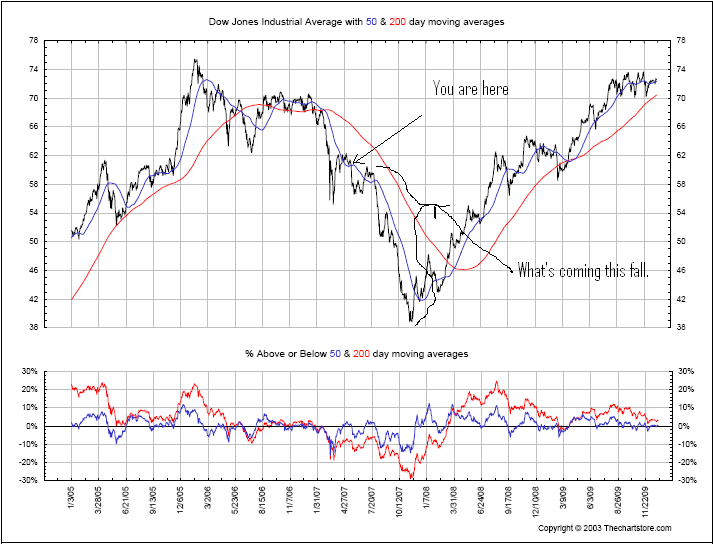
A similar conclusion is reached for the shorter-term: re-test the fall ’08 or March ’09 lows, then a weak bounce into the fall. This template, however, suggests the final leg down will be the most severe and worse than the Panic of 2008. This is certainly not out of the question!
And finally, the ultimate bear market of 1929-1932, during which the Dow Jones lost 89% of its value (chart source http://www.technicalanalysisbook.com):
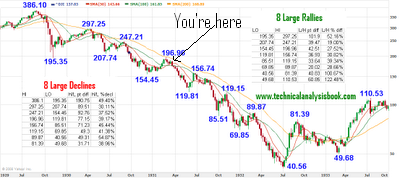
Even I’m not quite this bearish for the current cyclical bear market at this point, but I can’t rule out the possibility that this replays. We’re talking Dow 1400 and S&P 500 at 175 if a similar decline is coming.
In any event, this bear has a long way down to go and this is why my bullishness on the Gold mining sector is geared towards realism rather than irrational exuberance. No stock sector can make much progress higher under such conditions. Of course, once the dust settles, it will be time to bet the farm on Gold miners. But until the S&P 500 gets below the 500 level, I won’t be looking to “buy and hold” anything besides physical Gold as the ultimate cash equivalent.
Visit Adam Brochert’s blog: http://goldversuspaper.blogspot.com/
Adam Brochert
abrochert@yahoo.com
http://goldversuspaper.blogspot.com
BIO: Markets and cycles are my new hobby. I've seen the writing on the wall for the U.S. and the global economy and I am seeking financial salvation for myself (and anyone else who cares to listen) while Rome burns around us.
© 2009 Copyright Adam Brochert - All Rights Reserved
Disclaimer: The above is a matter of opinion provided for general information purposes only and is not intended as investment advice. Information and analysis above are derived from sources and utilising methods believed to be reliable, but we cannot accept responsibility for any losses you may incur as a result of this analysis. Individuals should consult with their personal financial advisors.
© 2005-2022 http://www.MarketOracle.co.uk - The Market Oracle is a FREE Daily Financial Markets Analysis & Forecasting online publication.