


US Treasury Bonds Retracement, But Still Bullish
Interest-Rates / US Bonds Jul 10, 2009 - 02:21 AM GMTBy: Frederic_Simons

 Desperate bond bears got their retracement in the 30 year treasury bond yesterday, as it gave back some of the huge gains of the last days. However, this does not change the bullish picture that can be observed when looking at the short and intermediate term charts.
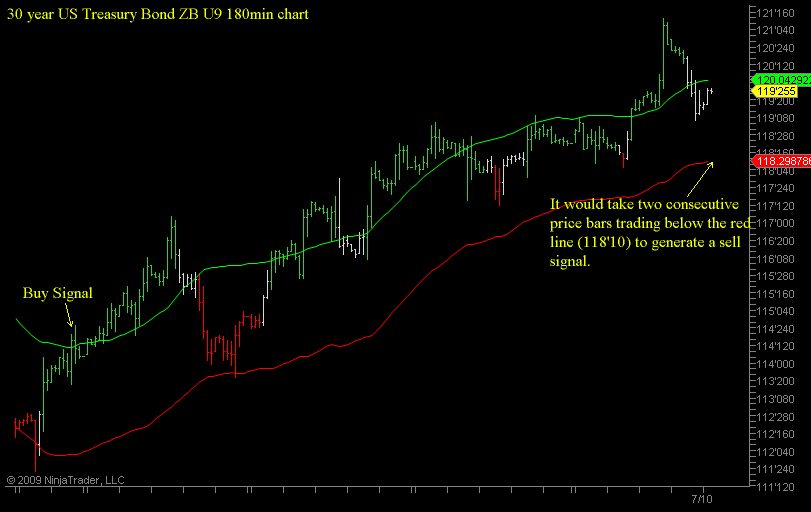
As you might already know, Crossroads FX uses an approach that bases short- and intermediate term trade decisions on the actual behaviour of prices, not on fundamental aspects. So we will rarely ask for any reasons "why" a certain price behaviour persists. Accordingly, we developed a proprietary indicator that identifies the line of least resistance both to the downside and to the upside, and prints them on the chart as a green line (buy line) and a red line (sell line).
You can see on the following chart that if the price trades for 2 consecutive bars above the green line, rising prices are to be expected. Once the price trades for 2 bars below the red line, you should prepare for falling prices:
Using this method, a buy signal on the 30year Treasury Bonds was generated on 6/12/09, enabling us to capture the best part of the current uptrend:
As you can see on the 180min chart, there is no compelling reason to become a bond-bear again unless prices trade below 118'10 for 2 consecutive bars.
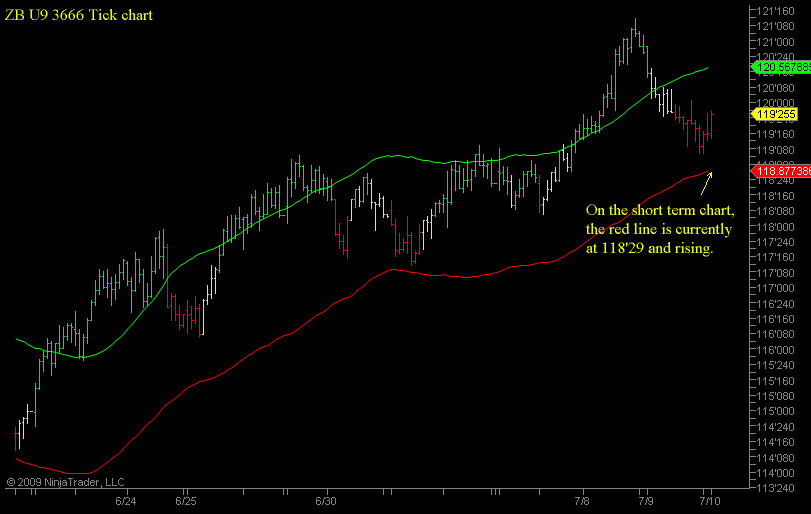
The shorter term 3666 Tick chart shows that the recent retracement has not yet done any damage to the uptrend, as prices stayed above the red sell line. The current uptrend would be in danger if 2 consecutive price bars would trade below 118'29 for two consecutive bars:
If you look at the 2-year Treasuries, the picture is still very bullish, as evidenced by a retracement that has been pretty small as compared to the 30 year treasuries:

As a conclusion, the 2 year and 30 year US Treasury Bonds remain in their current uptrend despite their recent retracements.
If you have any questions, please do not hesitate to contact us by writing an email to

By Frederic Simons
http://www.crossroadsfx.hostoi.com
© 2009 Copyright Frederic Simons - All Rights Reserved
Disclaimer: The above is a matter of opinion provided for general information purposes only and is not intended as investment advice. Information and analysis above are derived from sources and utilising methods believed to be reliable, but we cannot accept responsibility for any losses you may incur as a result of this analysis. Individuals should consult with their personal financial advisors.
© 2005-2022 http://www.MarketOracle.co.uk - The Market Oracle is a FREE Daily Financial Markets Analysis & Forecasting online publication.