Gold and Silver Analysis - Precious Points: Gold Don’t Go Gentle Into That Goodnight
Commodities / Gold & Silver Jun 10, 2007 - 10:01 PM GMTBy: Dominick
 Joe Nicholson (oroborean) writes: “Now that both gold and silver have climbed above, the 5-day moving average becomes an important support level which, though not inviolable, signals a relatively low risk/reward trade … losing the 5-day average in a single week from a fresh high that marks the crucial turn and ultimate retreat back into the 50-day level …
… If the impetus to cut rates is in fact removed, bond yields could be expected to reach a more historically normal level, above the overnight rate at 5.25% … it’s not the nominal rate, at least not at anywhere near these levels, as much as the rate of increase that would determine the effect on stocks and metals.”
~ Precious Points: Why This Rebound Looks Real, June 3, 2007
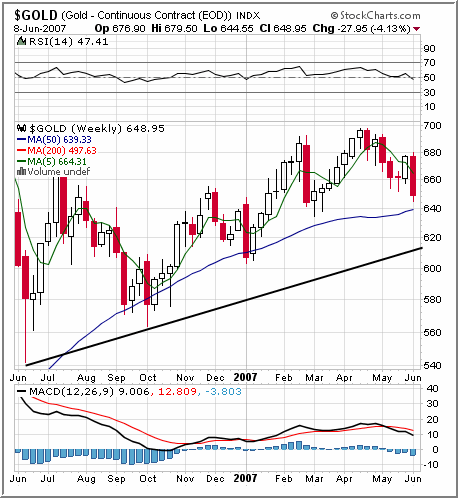
When it comes to the metals, bears hibernate for years, but bulls just retest the 5- and 50-day moving averages! Despite the way some may have interpreted last week’s title, the update was not without due caution. The purpose of the last two updates was simply to identify the 5-day moving averages in gold and silver as key price levels and the close above them both as markedly more bullish than previous weekly closes. Even after Thursday’s selling, which cut the DJIA by some 200 points, gold had only sunk to right about its 5-day moving average, verifying the importance of this level.
But, as you know, however, a rally in the dollar overnight, and continued pressure during the day Friday, left both gold and silver failing to make the two successive closes above the 5-day moving average that would have been interpreted as extremely bullish. As expected, losing the 5-day moving average lead to a decline into the 50-day moving average, which yet again proved to be strong support for the metals no matter how negative sentiment has become.

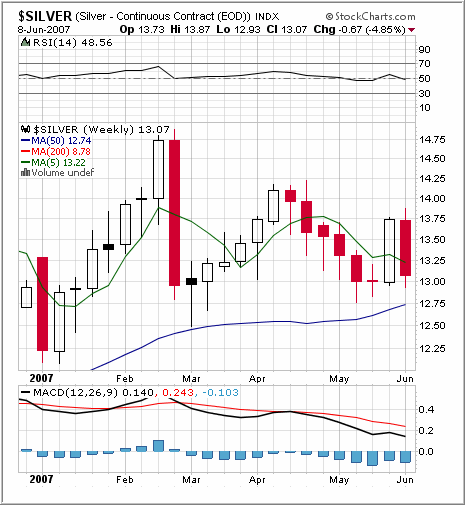
The chart above shows gold, at least so far, refusing to go gentle into that goodnight losing the 5-day moving average but still hovering above the 50. The trendline from June 2006 lows looms near $620, suggesting the gold bull will remain firmly intact even if stocks and metals come under a renewed bout of selling.The silver chart below shows a decidedly less promising situation. With its relative illiquidity and exaggerated price movement, the white metal often telegraphs moves in the precious metals complex. Lately, it’s been a pronounced underperformer, having already taken out its trendline up from last summer’s low and putting in two successive lower highs. More than gold, silver needs a move higher, and quick! The good news is that the RSI has reached levels that usually signal a decent bounce and, until silver takes out the 50-day moving average and ultimately the March low near $12.50, there’s still room for upside in silver, at least to strong resistance just under $14.

Even nonmembers without access to TTC’s trend cycle charts, forums and realtime chatroom would have known from the past several updates that another key indicator has been the Fed’s open market activities as measured by daily repos and the sloshing repo funds. The fact that a significant amount of repurchases were set to mature this week was an initial sign that it would take an intense round of new additions for the Fed to keep pace – and this is precisely where the rate of increase in bond yields became an ill omen for precious metals.Massive liquidation of securities and equities positions eliminated the need for new money from the Federal Reserve (remember the Fed injects liquidity to keep the overnight rate at its target 5.25% if demand for money increases). The end result was an almost daily reduction in base money that totaled a whopping $19.5 billion this week alone, about half of the total funds sloshing on the first of the month!
On the other hand, the greatest contributor to strength in metals during the week was the rate hikes in Europe and New Zealand. As foreign central banks raise their lending rates, the U.S. receives a de facto cut that tends to put pressure on the dollar and boosts metals. This worked until about midweek when a decidedly hawkish stream of rhetoric from Fed members, starting with Jeffrey Lacker two weeks ago, spilled over into a rapid swing in expectations from a rate cut to a possible rate hike – just in time to raise yields and shore up the dollar against the foreign hikes. In fact, the dollar gained ground on the week!
Certainly the decreased demand for new money, with lower commodities prices and dropping shipping rates, does suggest a moderation in inflation. The steepening of the yield curve over the past five trading days reflected a rise in inflation expectations as much as or more than actual rate hike concerns, and with inflation looking more and more contained on Friday, this also contributed to the neutral consensus outlook on the Fed and to bond yields slackening a bit.
As mentioned here repeatedly, domestic rate hikes from the Fed are highly unlikely with verdicts on the consumer and mortgage industry still not in, and consensus eventually centered on a neutral Fed. Friday’s trading vindicates last week’s position that a rate cut is not off the table absolutely, even if the markets seem to have priced it out any time in the near future. The balance is a neutrality that was a major factor in ultimately tempering the rise in bond yields, although of course not before significant damage was already done.
Overall, these developments leave metals in a precarious position. Inflation should be a friend to the metals, but with the Fed so quick to play the hawkish card, bond yields have now risen to a level from which any further moves would attract investor interest and reshuffle the entire deck. Of course lower inflation is traditionally bearish for metals, so it would appear the Fed has gold, the iconic commodity that will eventually give the lie to its inflation rhetoric and relative fiat currency valuations, in a stranglehold. But as long as the outlook for the U.S. economy is accelerating growth and, more importantly, global growth is still strong, inflation is inevitable and precious metals are a sound long term investment.
In the near term, the technical damage of the latest selloff makes new highs any time soon all the more unlikely, though closing above the 5-day moving average, now resistance, is a first step. Ideally, the remedy to this less than perfect situation would be a resurgence of fundamental factors that shocks the metals bull back to life. Without a doubt, this will eventually occur: demand will slack in the summer, but accelerate again later in the year; supply will began to slow if oil prices remain high or move higher, and if competition for equipment and infrastructure keeps miners from reaching their production targets. In other words, the bull is not dead!!
This week’s retail sales data will be critical in determining the health of the American consumer and setting the tone for the next move. New figures for CPI and PPI will also be watched closely. Given the delicate balance of forces and the high level of emotion in this market, any surprise in these numbers is likely to set off a big move. It appears anytime we see a steep correction in stocks, there’ll be a selloff in metals close behind. Maybe it’s a factor of the proliferation of the ETFs, maybe it’s liquidity and margin calls. Either way, metals have still not failed the support levels consistently outlined in this update over the past several weeks and highlighted again in the charts above. Until they do, the outlook will remain decidedly bullish, even if a sustained rally is still always just over the horizon.
Nonmembers and swing traders should use the 5-day moving average as a conservative measure, monitor the Fed’s open market activity, and continue seeking to buy dips.
oroborean
http://www.tradingthecharts.com
© 2005-2022 http://www.MarketOracle.co.uk - The Market Oracle is a FREE Daily Financial Markets Analysis & Forecasting online publication.


