


Gold Heading for $644 or $1200?
Commodities / Gold & Silver 2009 Aug 06, 2009 - 08:18 AM GMTBy: Ronald_Rosen

 What if a decline to $644 takes place before the exalted highs are obtained? Is this possible? How could it happen? What would cause it to happen?
The reality, as I see it, is that time is more important than price on the way down as well as the way up.
Please do not assume that I am predicting a decline in gold to $644 before the price takes off in a huge rise to heights unknown at the moment. I am not predicting a collapse in the price of gold. I am presenting technical reasons why we should be cautious and not overly optimistic. Caution is always warranted. You should never be overloaded with any investment or trade or borrowed up to the hilt in order to make a fortune.
A decline in the price of gold to $644 an ounce before the price moves up dramatically is in the realm of probability and is not just a possibility.
A study of the monthly gold chart with the Delta Long Term turning points will allow us to see a potentially incomplete correction that began at the high of $1,033.90 in March 2008.
Please remember this;
“Time is more important than price; when time is up price will reverse.”
W.D.Gann
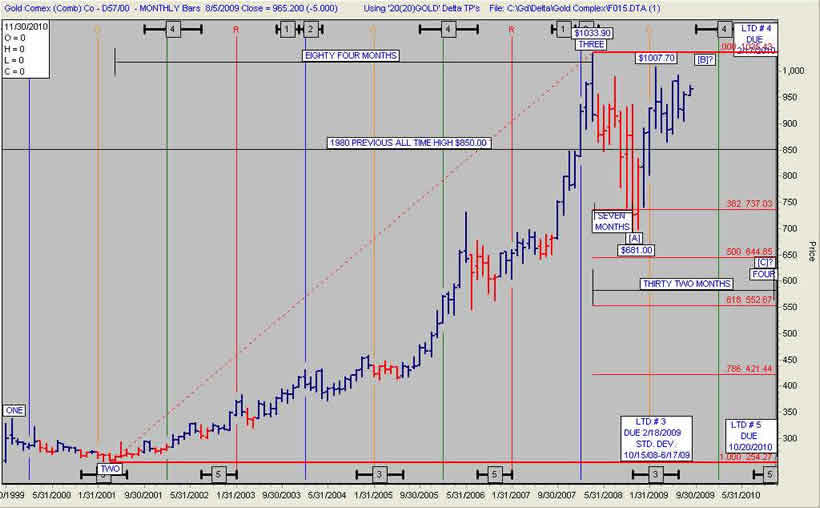
Wave counting is an art and not an exact science. However, if time is taken into consideration, the probability that a wave count is accurate is higher than if time is not part of your calculation. This monthly gold chart is labeled showing wave ONE, TWO, and THREE. Wave FOUR a corrective wave is shown as requiring one more leg down. That would be the [C] leg. Wave THREE is shown as having topped at $1033.90 in March 2008. From that point forward the chart shows leg [A] down, leg [B] up underway or complete at $1007.70. Leg [C] down is either underway or will be after a high above $1007.70. If there is going to be a 50% correction of Wave THREE the bottom should be in the vicinity of $644.00.
The Wave TWO correction down consumed 18 months.
The Wave Three move up from bottom to top is shown on the chart as having consumed 84 months.
The Wave FOUR correction down, so far, is shown as having consumed only seven months. Is a seven month Wave FOUR correction a sufficient amount of time to eliminate all the excess enthusiasm accumulated in an 84 month rising Wave THREE? This unanswerable question is the reason for caution at this time. Caution means do not be overloaded with gold shares at this time. If you are uncomfortably overloaded with gold and silver shares or commodity contracts or gold and silver ETF’s, it may be wise to reduce your commitment to a level that you are comfortable with.
GOLD MONTHLY CHART # 1
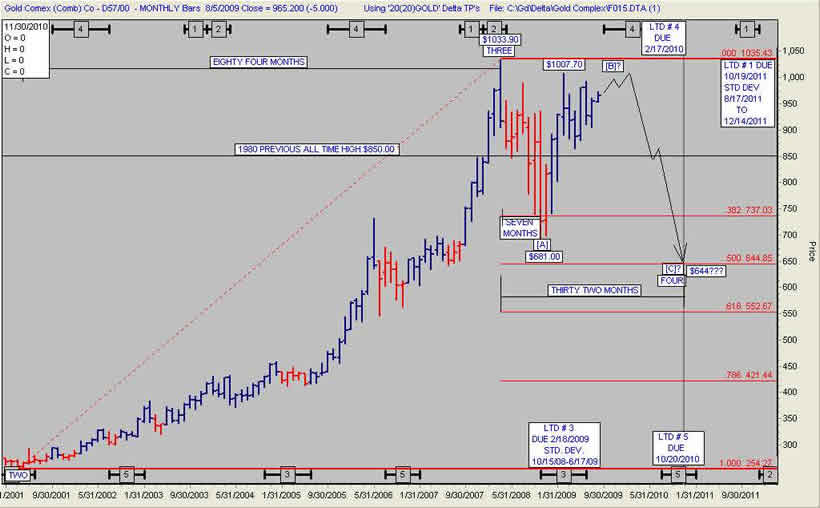
Wave THREE up lasted 84 months. A 38.2% correction of 84 months would be 32 months. If the Wave FOUR correction is going to last 32 months, a bottom will occur in the vicinity of LTD # 5 low. LTD # 5 low is due to arrive in October 2010.
The next high after LTD # 5 low is LTD # 1 HIGH due October 2011. The standard deviation for arrival of LTD # 1 high extends out to December 2011. We know that the biggest moves tend to occur on either side of DELTA # 1.
THIS IS NOT A RECCOMENDATION TO SELL YOUR PRECIOUS METAL SHARES OR BULLION OR COINS! This is strictly a presentation that contains technical reasons for caution, at this time, in your commitment to the precious metals complex. Please consider this update a warning not to be over committed or over borrowed because of excess optimism. It is always prudent to be cautious regardless of overwhelming bullish predictions by so many interested writers and now investment bankers. Caution, caution, caution is the byword.
Ron Rosen
GOLD MONTHLY CHART # 2
Subscriptions to the Rosen Market Timing Letter with the Delta Turning Points for gold, silver, stock indices, dollar index, crude oil and many other items are available at: www.wilder-concepts.com/rosenletter.aspx
Ron Rosen and Alistair Gilbert
M I G H T Y I N S P I R I T


Ronald L. Rosen served in the U.S.Navy, with two combat tours Korean War. He later graduated from New York University and became a Registered Representative, stock and commodity broker with Carl M. Loeb, Rhodes & Co. and then Carter, Berlind and Weill. He retired to become private investor and is a director of the Delta Society International
Disclaimer: The contents of this letter represent the opinions of Ronald L. Rosen and Alistair Gilbert Nothing contained herein is intended as investment advice or recommendations for specific investment decisions, and you should not rely on it as such. Ronald L. Rosen and Alistair Gilbert are not registered investment advisors. Information and analysis above are derived from sources and using methods believed to be reliable, but Ronald L. Rosen and Alistair Gilbert cannot accept responsibility for any trading losses you may incur as a result of your reliance on this analysis and will not be held liable for the consequence of reliance upon any opinion or statement contained herein or any omission. Individuals should consult with their broker and personal financial advisors before engaging in any trading activities. Do your own due diligence regarding personal investment decisions.
Ronald Rosen Archive |
© 2005-2022 http://www.MarketOracle.co.uk - The Market Oracle is a FREE Daily Financial Markets Analysis & Forecasting online publication.
Comments
|
Matt
06 Aug 09, 15:40 |
Please Read
Please be careful what you write. Thanks Matt |