U.S. Dollar May Soon Confirm a Secular Bear Trap Trend Reversal
Currencies / US Dollar Aug 09, 2009 - 12:55 PM GMTBy: The_BullBear
 In the last BBMR we focused on the US Dollar and concluded that a major break of very long term support was imminent and that a substantial devaluation of the greenback vis-à-vis its major currency pairs and commodities was likely. It’s always healthy to revisit one’s conclusions in light of developments in the market. Recent action has caused me to reevaluate and question the bearish view on the USD and commodities as well. I think that there is a valid bullish case to be made for the Dollar as well as a bearish case for gold, silver, oil and other commodities. I will explore these views in this report.
SUMMARY
It is possible that the US Dollar may have successfully tested very long term support twice while leaving behind double Bear Trap reversals much as the S&P 500 did in 2003 and 2009. We may be witnessing a transition from the Inflation/Reflation trade to the Economic Recovery and Growth trade. If so, this transition is coming far sooner than expected. There are major differences between the two trades, the most important of which involves the relationship between the Dollar and commodities. If the Dollar has bottomed, then the commodities bull is likely over and we will see falling prices for major economic inputs coinciding with renewed economic growth. This would be the most bullish configuration possible for the equities markets and may explain the rampaging, relentless bull move we are currently experiencing.
The US Dollar : “Not Acting Right”
Are you one of the millions of investors who wish they could have bought the equities bottom in March? Did you sit on the sidelines waiting for the opportunity to jump in but never pulled the trigger? Life rarely gives second chances, but it is possible that investors are being presented with a good substitute for catching the bottom in US equities, because an alternate way to bet on future economic growth in the US is to go long the Dollar. Let’s go back to the future and see how the current setup in the greenback may be reflecting a major buying opportunity on US prosperity.
Let’s start by looking at a very long term view of the US Dollar Index:
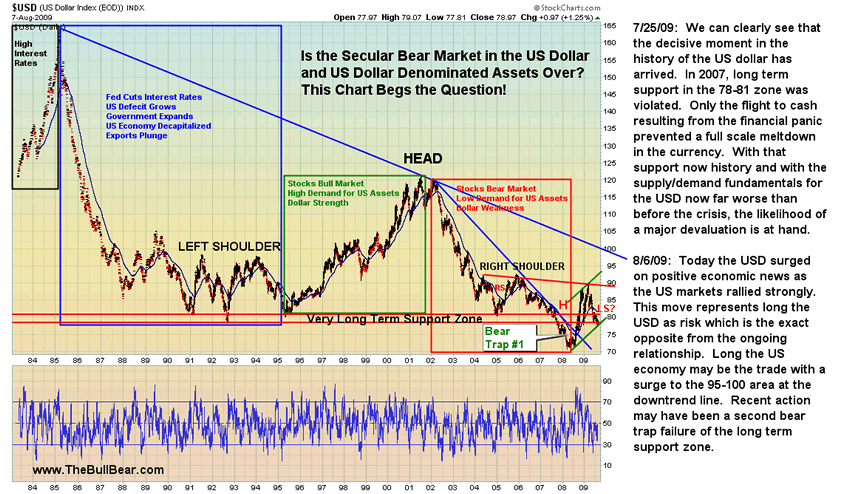
We can see that since the mid-1980’s (this is all the data that we have for the USD Index) there have been four distinct markets for the dollar with a fifth phase having potentially begun at the March 2008 bottom. Each market was characterized by a set of fundamental market and economic conditions. There isn’t time in this report to delve into all the details of each distinct phase. We will, however, touch on some areas here that help illuminate our current situation.
First, there is a clear area between approximately 78-80 on the Index that is denominated as the Very Long Term Support Zone. Dollar Bears have designated this zone as the line of demarcation that will designate the end of the Dollar as the world’s reserve currency and the onset of a hyperinflationary scenario which would also produce a major bull run in gold and other commodities. This zone was penetrated to the downside in October 2007 and was recovered in October 2008. Another prominent chart feature is an apparent Head and Shoulders formation the neckline of which was demarcated by the same Support Zone. This formation has apparently failed to complete since price has recovered above the neckline and held above it with a potentially successfully retest occurring in recent days. We can also see a potentially bullish Reverse Head and Shoulders formation the right shoulder of which may possibly complete in the coming weeks. Finally, the failed Head and Shoulders top pattern may have left behind two bullish Bear Traps, the first of which formed during the year long period that price spent below the support zone and the second much smaller of which formed over the last few days.
So where is this market today? What are its fundamental and technical characteristics now? Let’s zoom in a little for a closer look:
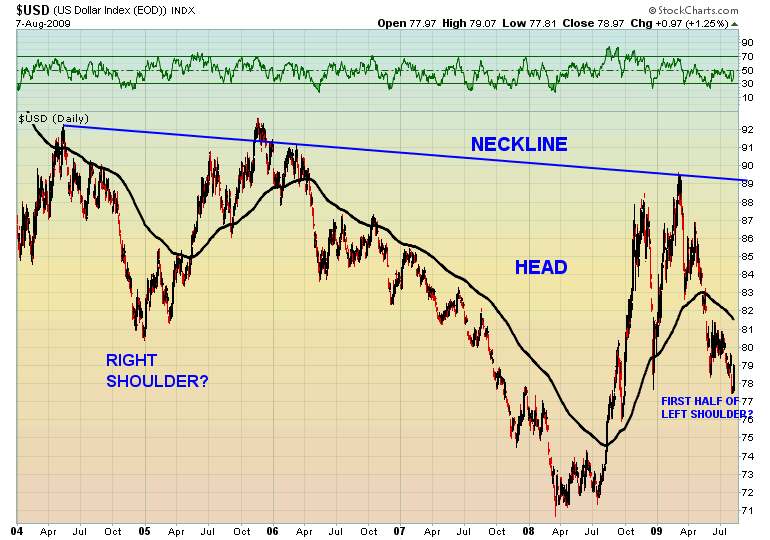
Here we have a closer view of the potential Head and Shoulders reversal pattern. If indeed price reverses in the next few days and recovers through the Support Zone then it may rally back to the neckline at 89. The distance from the neckline to the crown of the head is 18 points, so a break of the neckline would potentially produce an additional rally to 107. We’ll see in a bit that that would be a significant target.
Let’s step in for an even closer look:
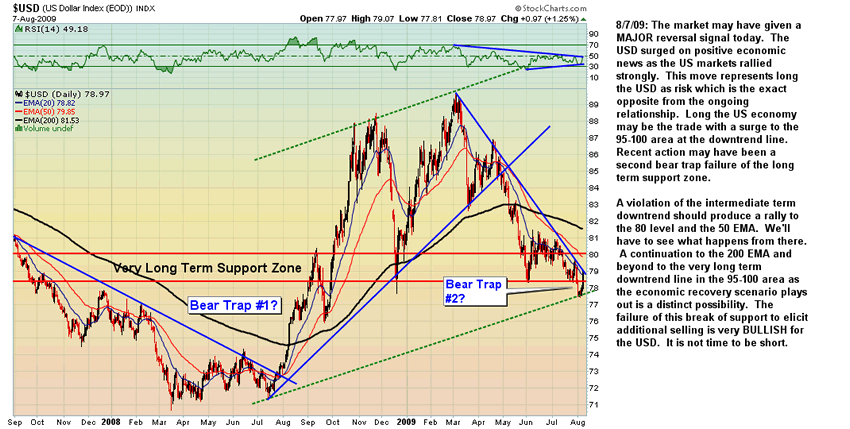
On 8/6-7/09 the market may have given a MAJOR reversal signal. The USD surged on positive economic news as the US markets rallied strongly. This move represents long the USD as risk , which is the exact opposite from the ongoing relationship. Long the US economy may now be the trade. Recent action may have been a second bear trap failure of the long term support zone.
A violation of the intermediate term downtrend should produce a rally to the 80 level and the 50 EMA. We'll have to see what happens from there. A continuation to the 200 EMA and beyond to the very long term downtrend line in the 95-100 area as the economic recovery scenario plays out is a distinct possibility.
The failure of this second break of Very Long Term Support to elicit additional selling is very BULLISH for the USD. Quite simply, the rally that occurred in the last two sessions should not have happened if the bearish thesis is correct. If a market does not do what ist should do when it should do it, then it is about to do the exact opposite in a big way. The Bear Traps on this chart are significant and powerful technical formations that cannot be dismissed. The probability that the Dollar is putting in a higher low at major support right now is very high. It’s also worth noting that the market is producing symmetry that supports this conclusion. Note that a perfectly parallel trend channel has formed with a low, a high and a higher low. It is not time to be short. If and when there is a weekly close below the lower green rail the bearish thesis will then be in play again.
Let’s take an even closer look at recent action:
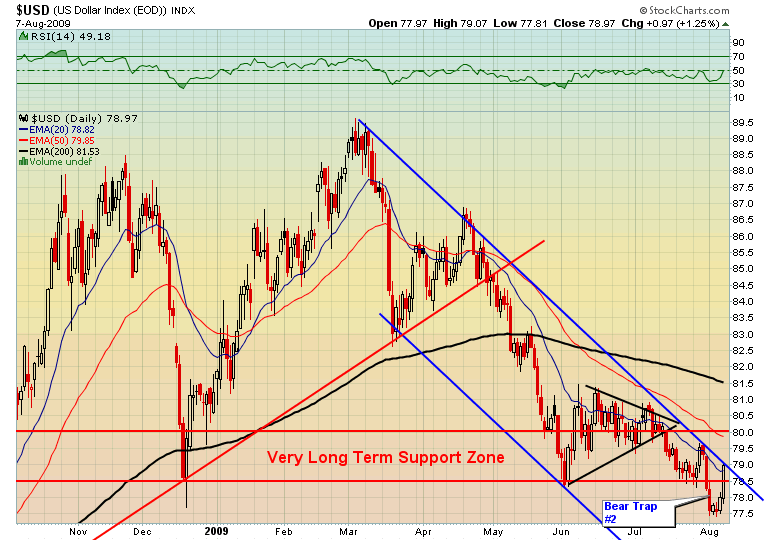
We can see that there has been a nice tidy downtrend channel off the March high. A recent test from below of the upper rail failed badly and led to a sharp break of the Very Long Term Support Zone. This break then hesitated for four sessions before reversing violently to the upside. Instead of a major breakdown to the lower rail of the channel we are now facing an upside breakout! It is difficult to describe the potential power of the move that could result from this setup, but I am going to try!
Let’s take a quick look at the very short term chart:
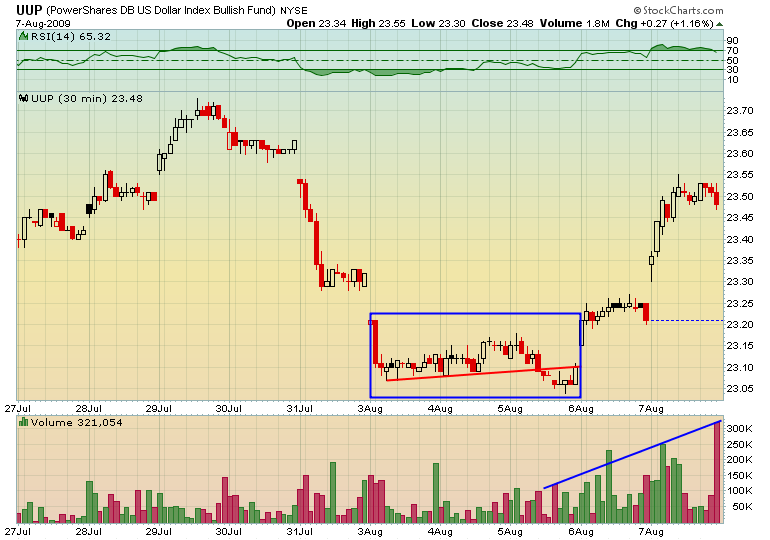
Using the UUP ETF as a proxy, we can see that instead of following through strongly to the downside as stops were activated, buyers stepped in over a four day period to support the market. Indeed, a breakdown below the range was immediately reversed to the upside and was followed by a monster up day on big volume. This is not the action of a market on the cusp of a major breakdown…but it may be that of a market on the verge of making a major bottom!
Many times I would close out a position before suffering a 10 percent loss. I did this simply because the stock was not acting right from the start. Often my instincts would whisper to me:J.L., this stock has a malaise, it is a lagging dullard. It just does not feel right, and I would sell out of my position in the blink of an eye.—Jesse Livermore
I was fortunate to heed Livermore’s words and closed out my profitable short position on the violent reaction in the GPB as the Bank of England declared an expansion of Quantitative Easing. The further reaction to good economic news with a rally in the Dollar was like a claxon resounding in my brain. It’s important to keep in mind that the US Dollar has consistently benefited from risk aversion not risk appetite. Indeed, it has been the transition from safety to risk which has characterized the Dollar’s decline from the March highs. This may have been a significant signal that the transition to a trade driven by future economic growth has begun.
Is It Déjà Vu All Over Again?
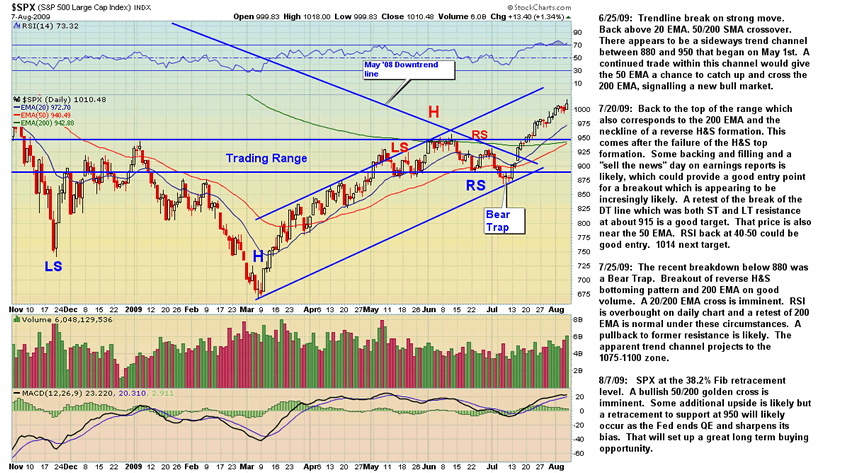
Let’s have a look at the bottoming process for the SPX to better understand the process that may be unfolding in the Dollar at this juncture. First, let’s look at the very long term chart:
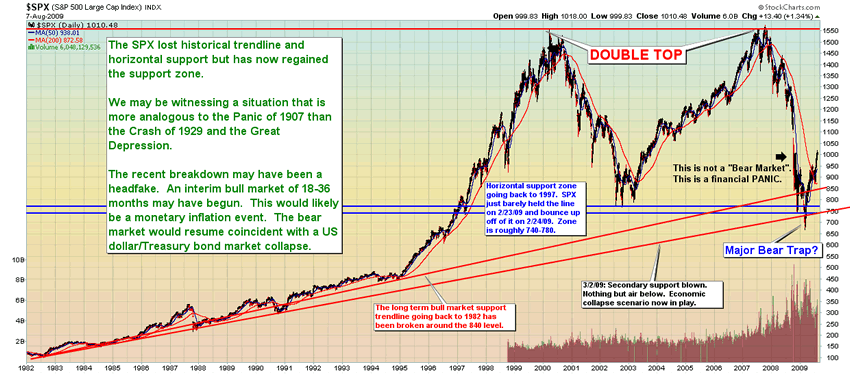
Like the Dollar, the broad equities market appears to have made a double bottom at a Very Long Term Support Zone. Both markets flirted with the edges of technical signals which would indicate secular breakdown. In the case of the SPX, a confirmed break would have signaled and economic collapse scenario. In the case of the US Dollar, it would have meant the loss of its status as a world reserve currency, a US Treasury bond sovereign debt crisis and a hyperinflationary scenario. The chart of the SPX appears to be telling us that the worst case scenario has been averted. The chart of the US Dollar may be painting a similar picture. We may very well know for sure sometime this coming week!
It may be March 2009 all over again this week. But the market to emerge from the depths of despair this time may be the US Dollar.
In March 2009 the entire world was bearish and rumors of total, global economic collapse were prevalent.Today the entire world expects the Dollar to decline and lose its reserve currency status. Talk of the Chinese Yuan eventually replacing it abounds!
In March 2009 the SPX was retesting and violated a very long term support zone. The break failed and left a Bear Trap in its place.Today the Dollar is retesting its very long term support zone. At this time it appears that the breakdown has failed and a second Bear Trap has been left behind. In April 2008, before the historically massive wave of fiscal and monetary stimulus created in the wake of the Panic of '08, the value of the US Dollar Index bottomed at 71. Today, after all the money printing, Quantitative Easing, stimulus and bailouts, the value of the US Dollar Index is 79, much higher than at its bottom. This may be the investor’s second chance to buy the bottom of the US economic turnaround trade.
Pattern Failures
There is nothing more bearish than a bullish technical setup which initiates to the upside and then abruptly reverses and fails. This week we saw precisely this happen to the Euro, the Swiss Franc and the British Pound. Here are the charts:
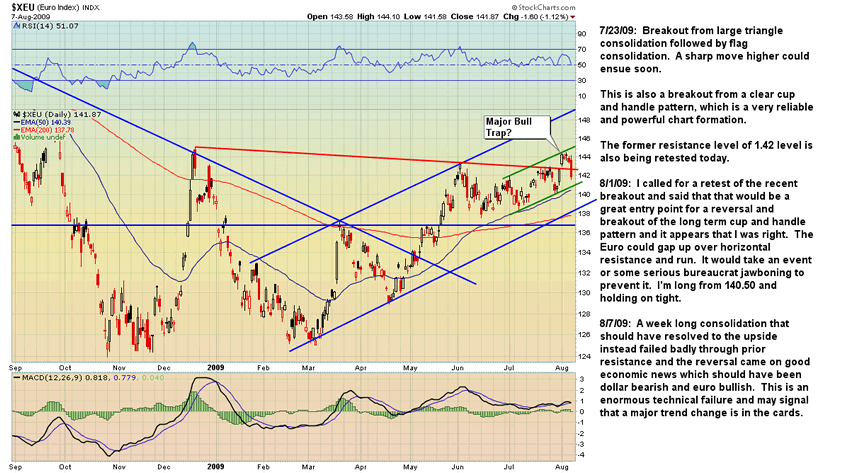
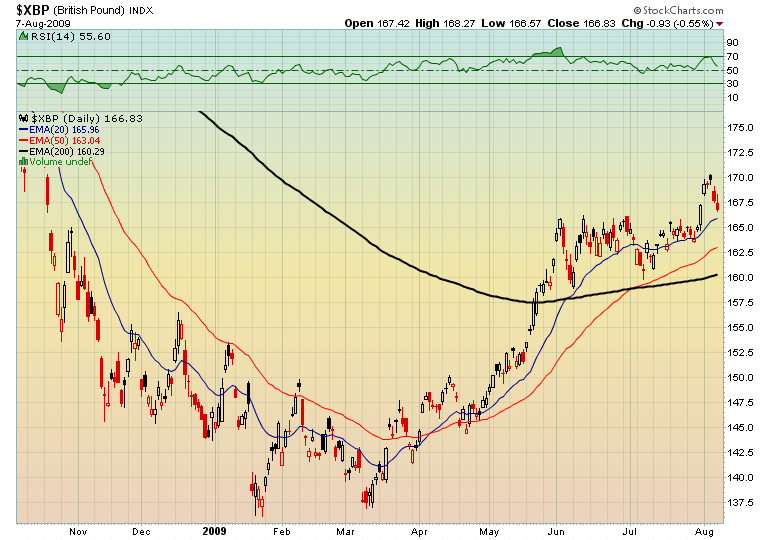
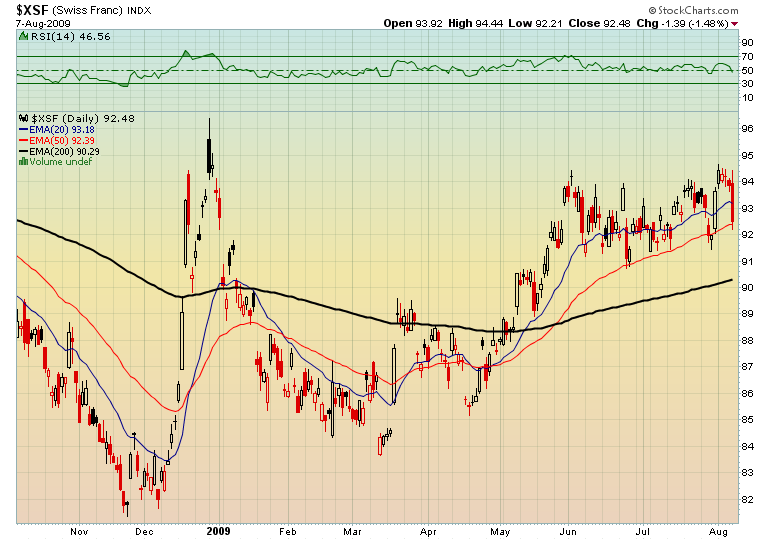
The Cup and Handle bottoming formation is among the most reliable and powerful in technical analysis. This is because it forms over a long period of slow, steady accumulation by longer term investors. All three of these charts show such patterns. They also show that the initial breakout from the handle was met not with additional buying and short covering but with a hesitation and then a violent reversal back into the handle. This could represent a mere retest of support before a resumption of the move. However, it seems more likely that the market is beginning to price in a slower than expected economic recovery in Europe and a stronger than expected recovery in the U.S. If this is the case then the breakdown out of these formations could be very dramatic as the patiently accumulated positions are dumped en masse. Short the European currencies may be a good play going forward. It is widely known that the Swiss government does not want the Franc to appreciate against the Dollar and will likely sell into the market to knock it down further.
Yen Carry Trade
Prior to the Panic of '08, the Yen carry trade was a major liqudity prop to world markets. Traders would sell the Yen short and invest in higher yielding assets. Of late, such has been the bearish sentiment extreme on the US Dollar that there has been frequent chatter in the establishment media that it is now the Dollar and not the Yen that is the carry currency. Considering that the interest rate on the Dollar is 1% and the Yen is set at .1% this would seem to be ultra bearish nonsense just on the face of it. Yet, until Friday the action in Yen market did leave room for speculation about the ongoing role of the Japanese currency in the world marketplace. Let's look at the chart:
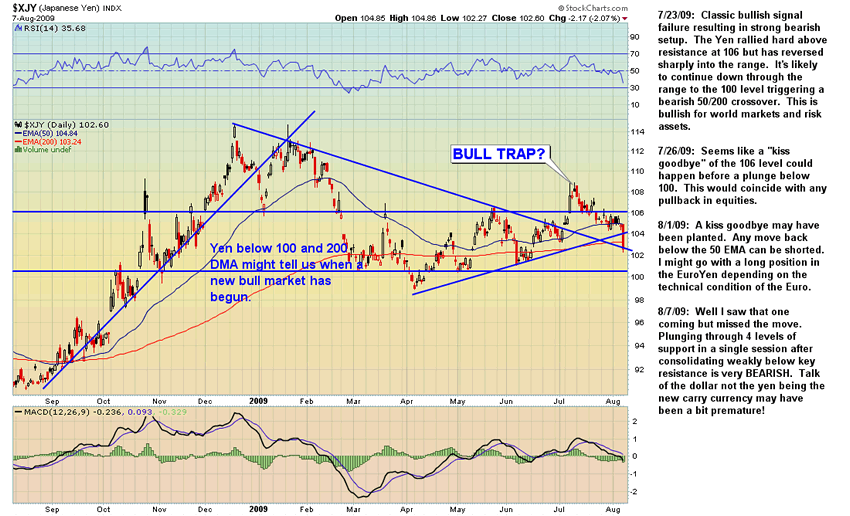
We can see that after spiking during the liquidity crisis as carry trades were covered en masse, it has since consolidated in a range between 106 and 100 with a slight upward bias. The chart has certainly been open to various interpretations. On Friday the Yen crashed through four levels of support and is likely to have begun a new bear market signaling the onset of the Yen carry trade anew. The spike to 109 in July remains as a clear Bull Trap and a selling opportunity. So, apparently traders will not be selling the Dollar against the Yen as a carry trade! And the US economy is not likely to be the new Japan.
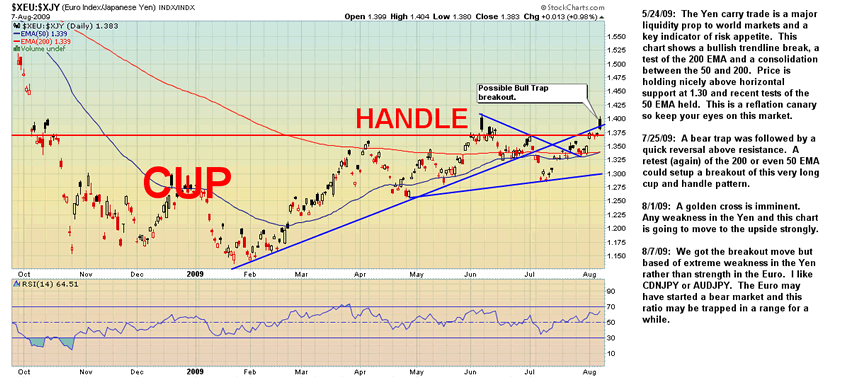
The EuroYen broke out on Friday, however given the possibility of relative European weakness in comparison to the US, I think that selling the Yen against one of the commodity currencies--or the US Dollar--would be the new carry trade. So in effect, the carry trade may in fact now be the exact diametrical opposite from the ultra Dollar bearish scuttle being bandied about in the financial news media in recent weeks!
Commodities Bear Market?
The commodity currencies—CDN, AUD and NZD-- may possibly hold up better in a Dollar bull market, but that may depend upon a continued bull market in commodities. Let’s have a look at the technical condition of some key commodities markets.
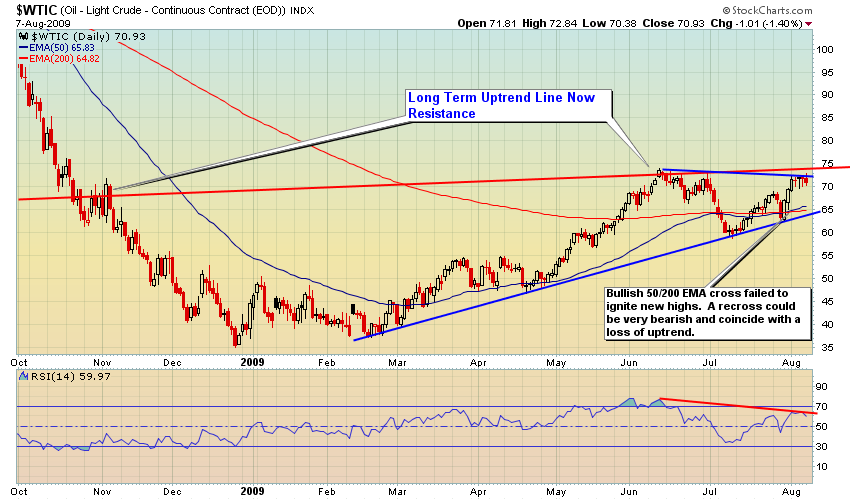
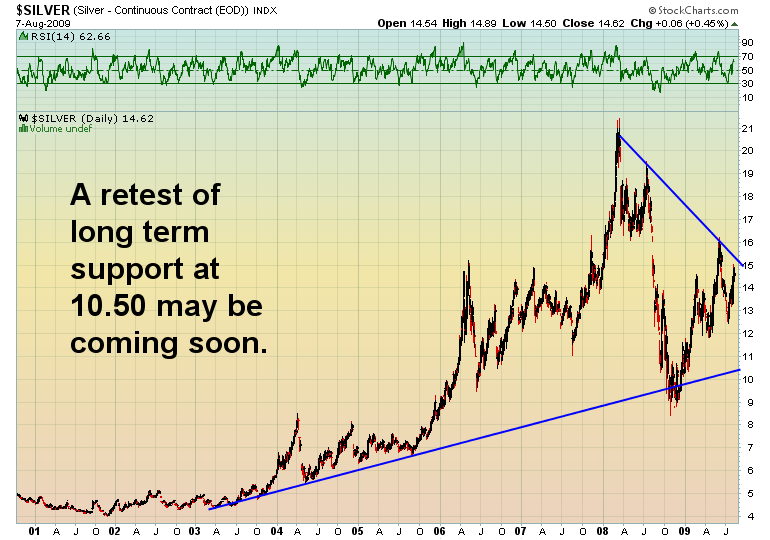
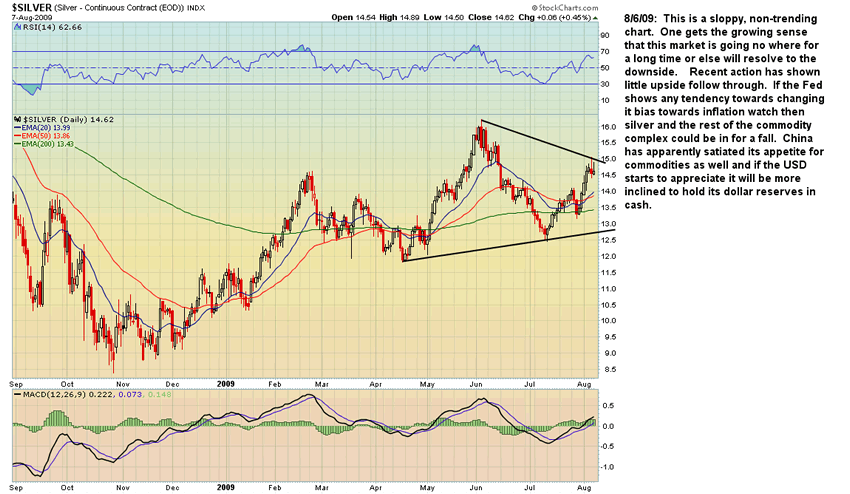
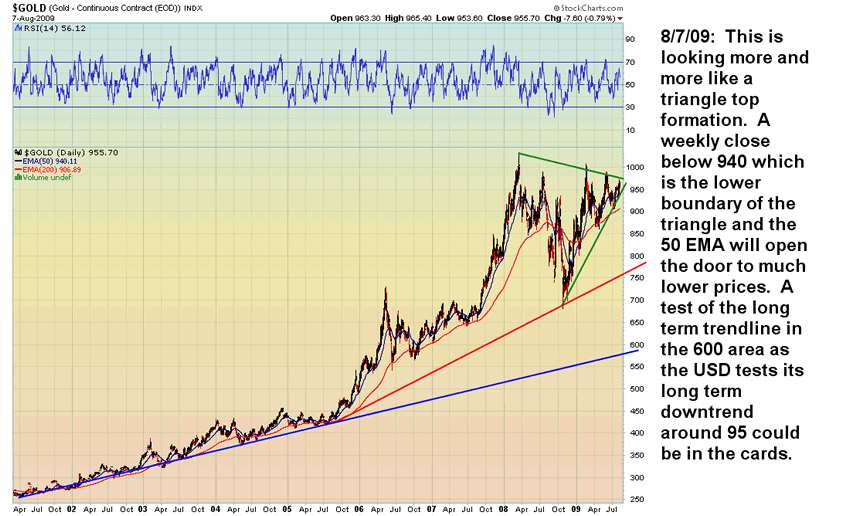
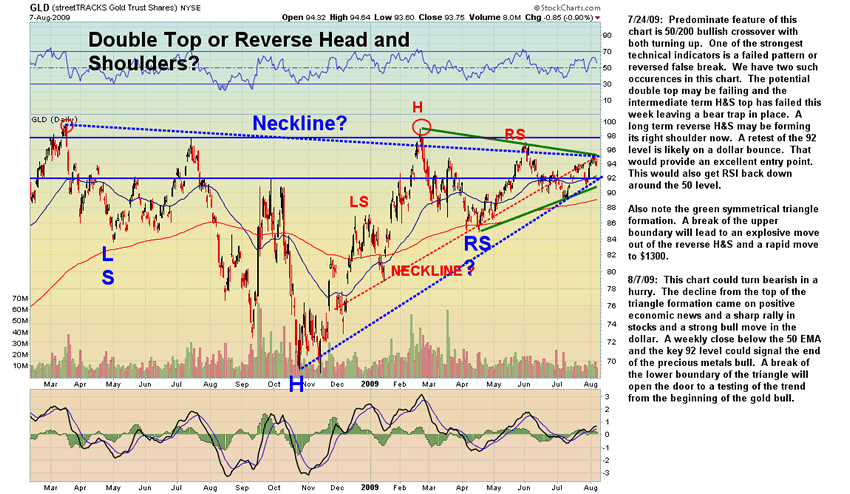
A review of these charts finds that they are all at or near significant technical resistance and vulnerable to a reversal. Any change to the current monetary environment, particularly a Dollar rally, could send commodities into a marked decline.
Here are some points to consider:
• The commodities complex may be set up for a hard fall if the inflation trade is off and the economic growth trade is on. Why? Only inflation can justify the historically high prices at which commodities are currently trading. The supply/demand configuration alone is insufficient to support continued nosebleed pricing. If the dollar rallies and enters a bull market, by definition the inflation trade is off.
• The CFTC will likely impose new regulations on “speculation” in crude oil soon
• If the threat of economic collapse followed by the most massive inflation of the monetary supply in history is insufficient to drive gold and silver to new highs, then what will? Time is running out on the precious metals bull. It’s time to make a move or a melt down may occur.
• China has apparently reached the end of its commodities stockpiling and if the USD does begin to appreciate in value it will likely hold on to its reserves in cash for a while.
• With signs that the US economy is on the mend growing daily, the chances that the Fed will announce an end to Quantitative Easing and/or bring an end to other emergency measures as well as move to a neutral or tightening bias on interest rates is growing. The Fed will likely surprise in this direction on Wednesday which will be very Dollar bullish.
• Was Treasury Secretary Geithner’s recent whirlwind tour of America’s major Dollar holders to inform them that the Fed would end Quantitative Easing and otherwise tighten its monetary policy?
Finally, let’s look at the GDX, the ETF for mining stocks:
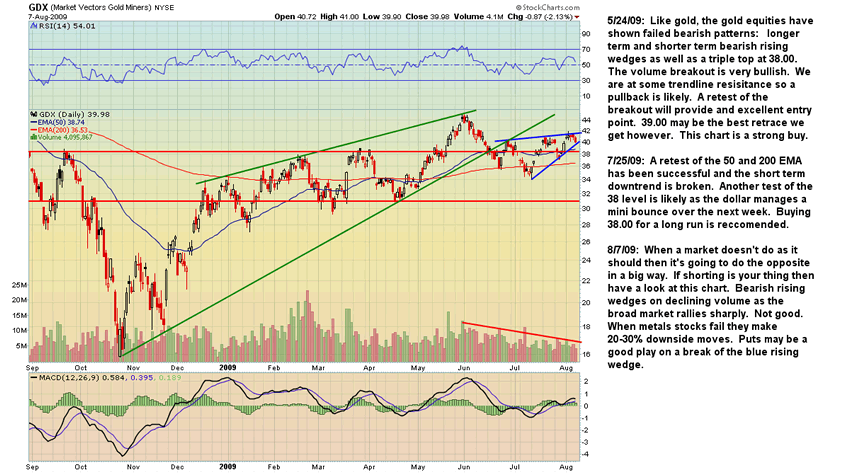
This market is simply failing to participate in the broad market rally. This is an important negative divergence and does not bode well for gold, silver or commodities in general. Generally the miners lead a bull move in the metals. Here they are lagging badly. This is not a promising setup. A serious meltdown could ensue at any time.
Dead Ahead
There may be a major turn in the road dead ahead. On Wednesday the Federal Reserve Bank will issue its decision on interest rates as well as its policy report. I think there will be a surprise or two that will be Dollar bullish. I will not be surprised that the Fed brings an end to its Quantitative Easing program and/or announces the termination of other inflationary emergency measures. It may be that the recent Dollar strength has been pricing in this eventuality. Of course, should the Fed fail to deliver any such surprises then the Dollar may indeed resume its plunge.
If the Fed does deliver the aforementioned surprises, I think the equities markets will finally sell off as investors fret that they are “taking away the punch bowl” too soon. The sell off should be sharp but brief and would likely find support at the recent breakout around SPX 950. This should be an excellent entry point.
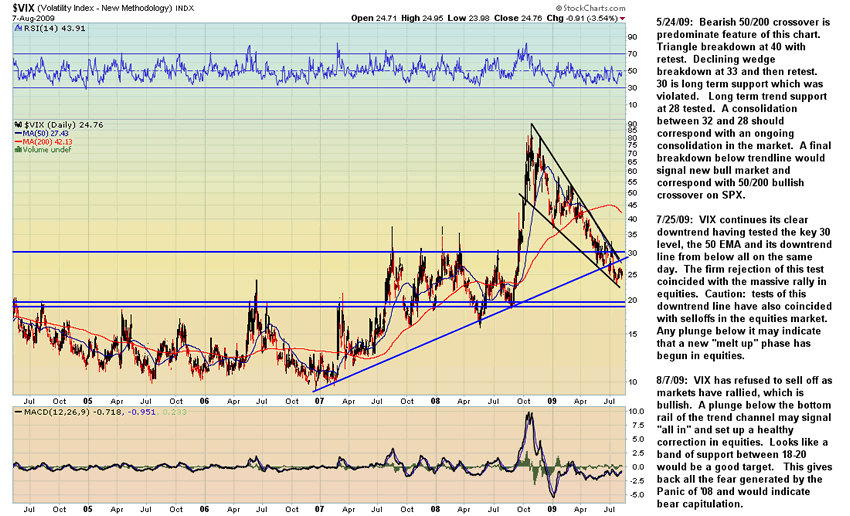
In the above scenario, commodities will also sell off since the commodities bull is built on inflation and the expectation of future inflation. But whereas I expect stocks to rebound quickly, I think commodities will not recover and will either trade within a range or go into a gradual, steady decline. Gold and silver will likely suffer the most. I'd like to see the VIX spike hard to long term support to put in a good top for a selloff which would then set up a good buy entry.
What Economic Growth?
If the Dollar is to rally on future US economic growth then where is this growth going to come from? One word: Technology.
It has been 12-15 years since the last technological revolution brought us a personal computer in every home and the internet. We are long overdue for another wave of game changing technological innovation. In short, here comes Nasdaq Bubble II. Let’s look at the charts:
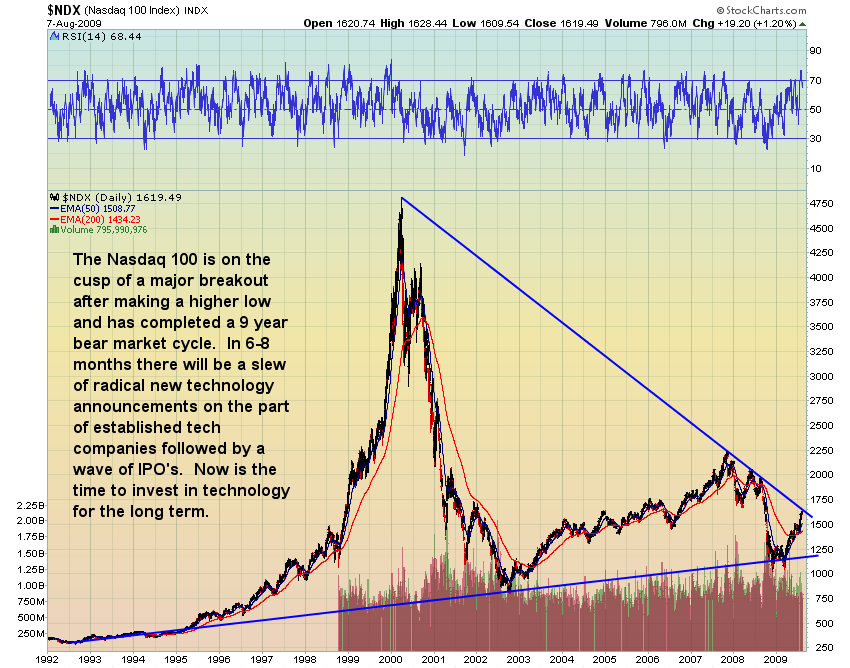
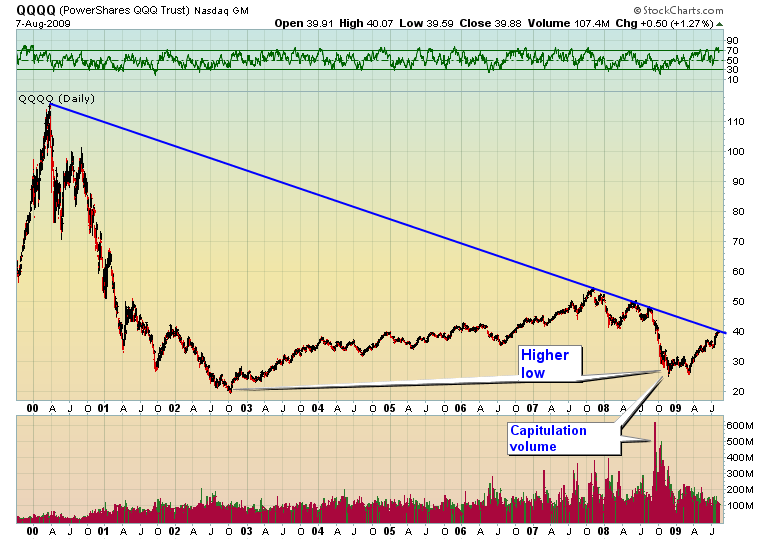
The Nasdaq is about to end its nine year bear market after having found support at its very long term bull market trendline with a major breakout of the downtrend —or else fail to do so. If it succeeds, the market is sending a clear message about the future of the economy. Expect major announcements from leading tech giants regarding new technologies and new products within 6-8 months. A wave of IPO’s should follow soon after.
I might add one other word: Infrastructure. The highways, bridges, rails and ports of this country are outdated and in disrepair. A renewal of this infrastructure on an ultramodern basis will be a major engine of growth for years to come.
Yes, It’s a Bull Market
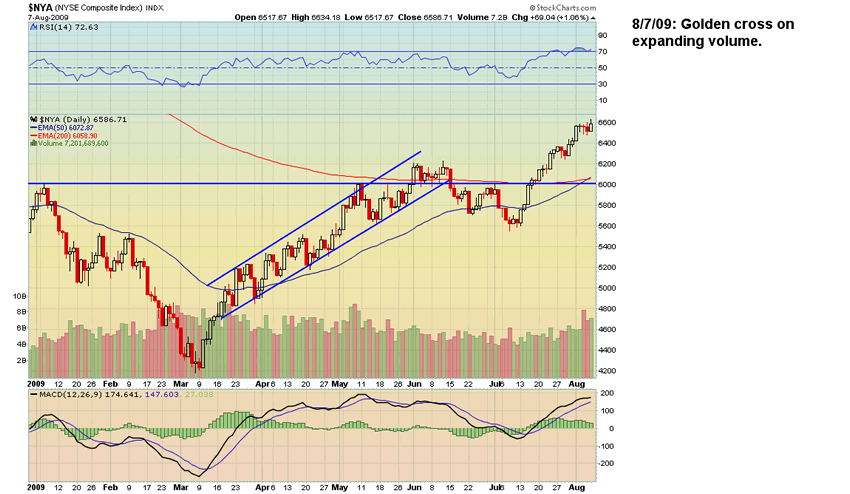
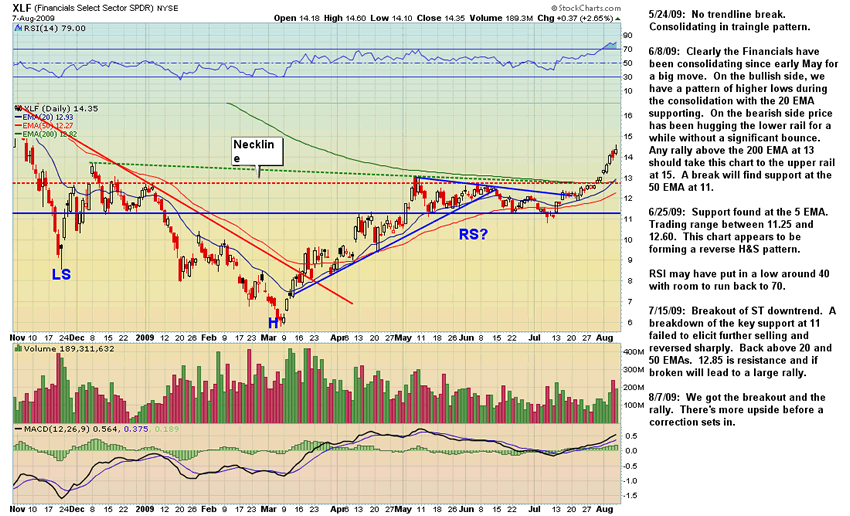
The establishment rigged a liquidity crisis and then the news media, government officials, the financial establishment, the Treasury and the Federal Reserve sold you the lie that an economic collapse was imminent to force you out of your stocks and prevent you from buying in at rock bottom prices while they accumulated from October to June. Now that they have their lines the pumping, measured by continued “Wall of Worry” hype, will begin. This is how the game is and always has been played. The pictures say a million words:
Please do comment on this article. A lot of hard work goes into preparing this report and it's good to know that someone is reading it and hopefully benefitting from it!
By Steve Vincent
The BullBear is the social network for market traders and investors. Here you will find a wide range of tools to discuss, debate, blog, post, chat and otherwise communicate with others who share your interest in the markets.
© 2009 Copyright Steven Vincent - All Rights Reserved Disclaimer: The above is a matter of opinion provided for general information purposes only and is not intended as investment advice. Information and analysis above are derived from sources and utilising methods believed to be reliable, but we cannot accept responsibility for any losses you may incur as a result of this analysis. Individuals should consult with their personal financial advisors.
© 2005-2022 http://www.MarketOracle.co.uk - The Market Oracle is a FREE Daily Financial Markets Analysis & Forecasting online publication.


