


Stock Market Investing, Is Buy and Hold Back?
Stock-Markets / Stocks Bear Market Aug 10, 2009 - 02:49 AM GMTBy: Joseph_Russo

 Hop on board or you’ll miss the train
Our trusted shepherds of illusion would like nothing more than to ignite another round of buy & hold fever as the only means by which participants can hope to survive in the speculative buying frenzy that has occurred in equity markets since the March low. Thus far, the measured results of their handiwork have them grinning ear to ear.
When it comes to stocks, buying panics without limit are good and encouraged, while selling panics cause crisis and the threat of systemic collapse. Speculation, which drives Oil prices to stellar heights, is bad, but speculation driving equity prices to unsustainable extremes is good. It is asinine to pick systemic winners and promote their upside into perpetuity and then to enact emergency fascist interventions to save such systems of monopoly when systemically encouraged price bubbles inevitably burst.
Perspectives in Trend
In lieu of our customary “Markets at a Glance” medley, this week we are going to take a close look at the Dow in various timeframes. We start by examining a daily price chart of Dow, which reflects the sudden V-shaped surge in bullish optimism from the March low.
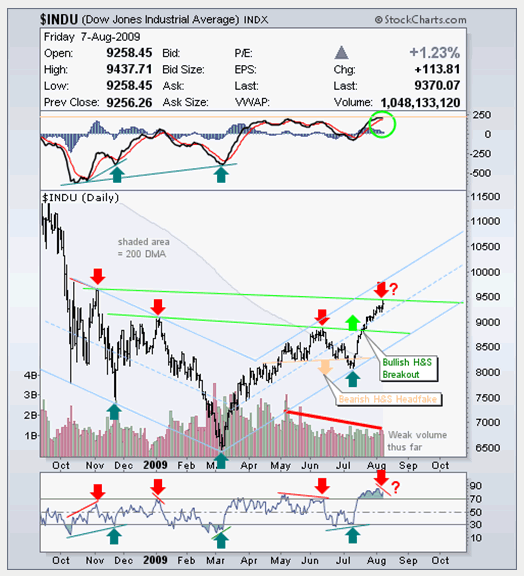
Anatomy of a short-term Bullish Stampede
We have arrowed three clear buy signals (dark green) and three clear sell signals (red) as we visually traverse the daily charts time span from left to right. Following a third major chart low in March, the intervention led bullish stampede began, and beyond a brief head fake in June, has hardly looked back since.
We call readers attention to the extremely wide down trend channel, which occurred from October through the March low, which is in direct contrast to the very narrow uptrend channel created from the V-shape intervention led rally. Many suggest the low of March had fully priced in an Armageddon scenario. We suspect the lows printed in March were only part way there. Had it not been for such extraordinary fascist interventions, the Dow would have easily gone on to lose 80% or 90% percent of its value. Having said that, we must now consider to what heights asset price may rise in response to the massive interventionist distortions that have now achieved early signs of success in fostering the desired bullish stampede.
The daily chart above also notes the failed bearish head & shoulder pattern (tan down arrow) everyone was clamoring about in late June early July. We also note the much larger bullish head & shoulder pattern (bright green up arrow) which has thus far held well above its neckline breakout to the upside. Unfortunately, for bulls, volume has not confirmed the V-spike from March, and the most recent momentum reading is signaling the possibility of a sell trigger (red down arrow in question). On a somewhat bullish note, the MACD has registered new highs, but threatens a bearish cross from extreme levels of short-term overbought.
Our next chart below examines the Dow from the perspective of a weekly price chart dating back to late 2005.
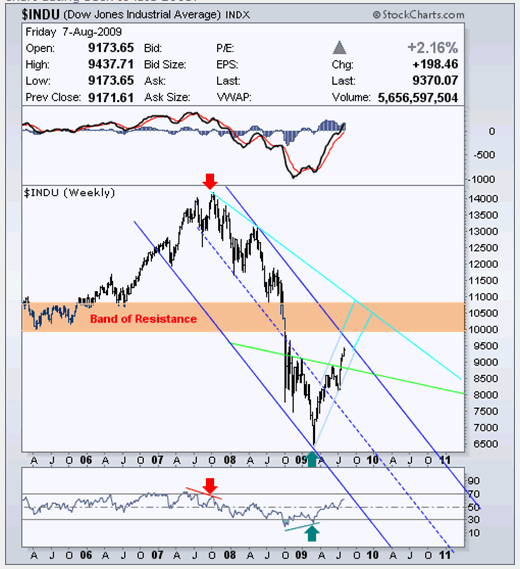
Overhead Band of Resistance not far off
Despite the surge in optimism and hubris of a brand new bull market with no end in sight, the longer back one peers, the more evident the substantial damage inflicted by the bear becomes, and the less impressive the recent rally appears. We have illustrated a 1000-point band of congestive resistance between the 10K and 11K levels on the weekly chart above. The area above the band is representative of levels to which the Dow should have never traversed in the first place. The upper end of the band is the horizontal point at which the Dow collapsed, while the lower end of the band reflects heavy resistive congestion from 2005, which appears only as a thin zone of no resistance whatever should one only examine this market from the all time high in 2007.
Potential Secular Downside Confirmations
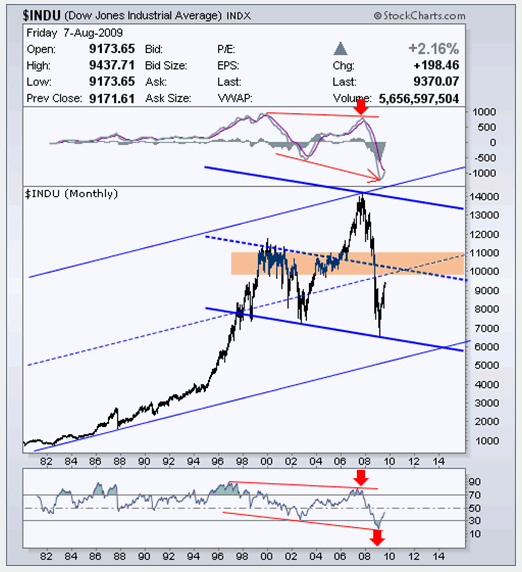
As the below 30-year monthly chart from 1980 shows, we can still define a rising price channel indicative of a continuing secular bull market. We can also see three major lows occurring in 1998, 2002, and most recently in 2009. Both momentum and MACD indicators confirmed each of these lower, lows. The succession of confirmed lower lows over the past decade suggests it is plausible that we have witnessed the end of a secular bull and the onset of a secular bear.
Per the monthly perspective above, the tone remains firmly bearish. Here we see the Dow concurrently racing toward its rising mid-channel resistance of what remains of the secular uptrend channel, and toward a falling mid-channel boundary associated with its plausible secular bearish downtrend. For reference, we have also located the horizontal band of resistance from our previous chart.
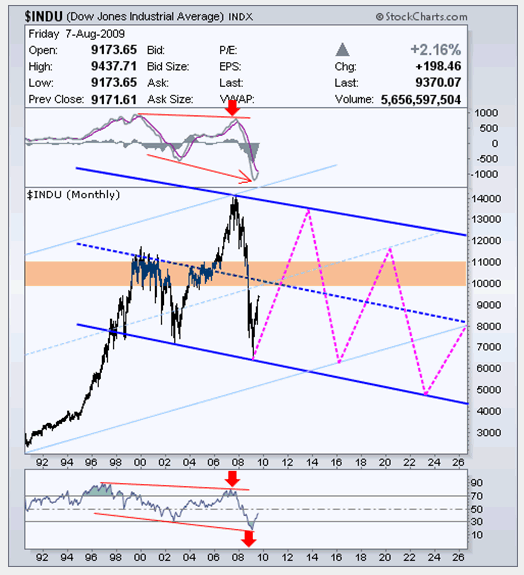
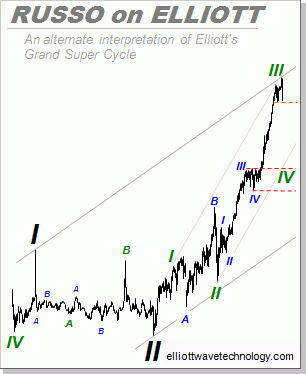
Traversing along path toward SUPERCYCLE IV
If the secular bear market thesis prevails, the chart below illustrates one forward-looking pathway that the next generation may refer to as the notorious SUPERCYCLE IV wave.
In our view, a pathway of this general nature is the very best that our trusted shepherds of illusion could possibly hope for. From its onset in 1999, the bearish secular path of SC-IV would include four devastating bear markets, and only three interventionist bull markets. At the end of the SUPERCYCLE, it is assumed and hoped that the misdeeds of our fallen stewards will have been largely corrected, and the market will once again be on path of a more prudential and sustainable course.
So where does this leave us in the interim
Well, on one level, engagement on the long side the market is necessary, while at another level, it is also prudent for one to consider building short positions amid a market stretching near-term levels of overbought to manic extremes.
We cannot stress strongly enough that one size does not fit all – especially when it comes to putting ones hard-earned money to work in the equity indices.
Overtime, equity markets inevitably succumb to reality vs. continually rising amid the perpetual hype of never-ending bull markets. That is why in our view, bulls make money, bears make money, and it is why our trusted shepherds of illusion repeatedly slaughter the one size fits all (buy & hold) pigs.
Elliott Wave Technology vs. the DOW
Diligently adhering to the one size does not fit all mantra; the bar chart below reflects Elliott Wave Technology’s premium advisory performance results vs. the Dow at its five proprietary levels of engagement.
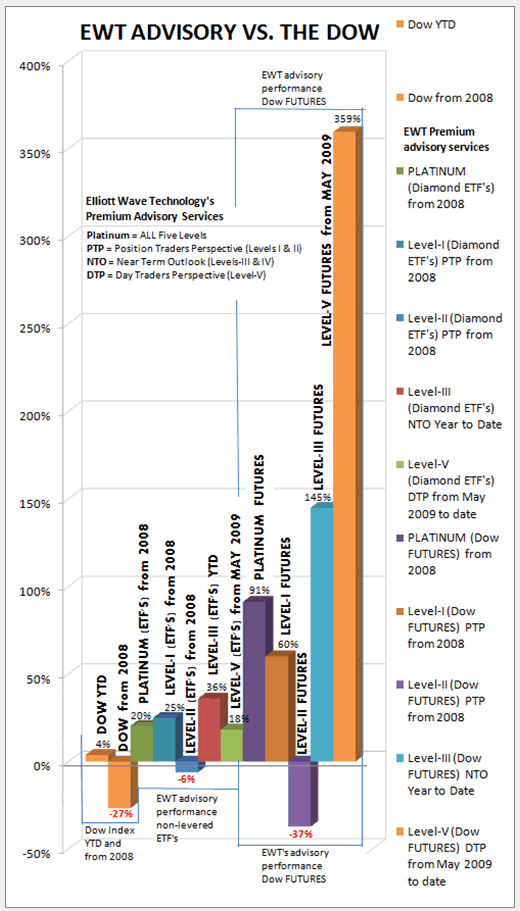
We have divided the bar chart above into three categories. From left to right, the first two bars represent the first category, which reflects the Dow’s YTD performance (up 4%), and the Dow’s performance from 2008 (down 27%). Now that sounds a bit more realistic vs. the mainstream mantra which echoes something like; hurry, hurry, hurry, buy, buy, buy, the Dow is up 45% from the March low, and the new bull market is leaving without you.
The middle five bars representing the second category reflect the non-levered ETF performance results delivered via Elliott Wave Technology’s premium advisory services amid matching timeframes. In this segment, which contains five performance bars, the total operation of PLATINUM is up 20%, while Levels-I, III, and V are up 25%, 36%, and 18% respectively. Level-II was the only one of our engagement levels that has registered a modest 6% loss from 2008 vs. that of a 27% loss in the Dow itself.
The last five performance bars represents the third category reflecting the leveraged performance of futures. In this last and highly leveraged segment, the total operation of PLATINUM is up 91%, while Levels-I, III, and V are up 60%, 145%, and 359% respectively. Level-II was the only one of our levered engagement levels that has registered an underperforming 37% leveraged loss from 2008 vs. that of the actual 27% loss in the Dow itself. As an aside, please do not be seduced by the 359% YTD gains in LEVEL-V, as they were approaching 500% just one month ago. Level-V is highly volatile, and drawdowns can mount as quickly as profits amass.
BOTTOM LINE – No Matter where the market goes or when
First, never trust markets to take care of themselves in aligning their paths with your objectives and timeframes whatever they may be. Second, never be seduced by interventionist market action fostered by shepherds of illusion, and last and most important; engage markets with specific disciplines aligned with reasonable objectives and timeframes to which you can consistently adhere.
In effort to get as many individuals acquainted with and experience the direct power of PLATINUM, we are in process of developing plans to provide three months of daily access to qualified applicants for less than .75 cents per day. See our closing remarks below and stay tuned for further details.
The Complete Speculative Landscape for Equity Index Traders
We are the “Simplicity Experts” of navigation amid the broad equity markets. Our realistic, well-organized visual approach in chart presentation incorporates a disciplined blend of technical best practices. This presentation framework enables us to translate, organize, and simplify (BY STRATEGIC LEVEL) the otherwise complex, and challenging tasks inherent in navigating safely throughout the entire speculative process. The result is our ALL-NEW full-spectrum PLATINUM service, a simple but comprehensive trading publication, which provides clients with prudently actionable speculative guidance amid all time horizons. In effort to get as many individuals acquainted with and experience the power of PLATINUM, we are in process of developing plans to provide three months of daily access to qualified applicants for less than .75 cents per day. See our closing remarks below and stay tuned for further details.
 Trade the Supercycle IV -Wave
To safely speculate on, and effectively trade the endless array of unfolding subdivisions forthcoming in SC-IV, one may subscribe to any of our premium advisory services.
The express focus of Elliott Wave Technology’s Near Term Outlook is to provide equity index traders with actionable guidance over the near and medium term.
Position Traders Perspective provides actionable guidance for the long haul, while our Day Traders Perspective assists short-term traders in executing proprietary methodology for capturing price moves of short duration.
Elliott Wave Technology’s PLATINUM 500 CHALLENGE:
In our effort to serve and empower as many individuals to trade profitably amid the sharks on the street, we will soon be announcing the availability of $500 PLATINUM service coupons. We shall award these incredibly generous service coupons to select individuals who apply and qualify for entry. We will let those interested know when entry applications for the challenge become available, and shall announce further details of the PLATINUM 500 CHALLENGE as they develop, so stay tuned. If you are interested in pre-qualifying, send us an email containing “PLATINUM 500 CHALLENGE” somewhere in the subject line or body of the email. We will place your email address on our secure list of PLATINUM-500 applicants, and keep you apprised of further developments and qualification criteria.
Until then,
Trade Better / Invest Smarter...
By Joseph Russo
Chief Editor and Technical Analyst
Elliott Wave Technology
Email Author
Copyright © 2009 Elliott Wave Technology. All Rights Reserved.
Joseph Russo, presently the Publisher and Chief Market analyst for Elliott Wave Technology, has been studying Elliott Wave Theory, and the Technical Analysis of Financial Markets since 1991 and currently maintains active member status in the "Market Technicians Association." Joe continues to expand his body of knowledge through the MTA's accredited CMT program.
Joseph Russo Archive |
© 2005-2022 http://www.MarketOracle.co.uk - The Market Oracle is a FREE Daily Financial Markets Analysis & Forecasting online publication.