Back to the Future for the US Dollar, Addendum- The Japanese Yen
Currencies / US Dollar Aug 11, 2009 - 01:11 AM GMTBy: The_BullBear
 This is an addendum to the recent BullBear Market Report:U.S. Dollar May Soon Confirm a Secular Bear Trap Trend Reversal
Yen Carry Trade
Prior to the Panic of '08, the Yen carry trade was a major liqudity prop to world markets. Traders would sell the Yen short and invest in higher yielding assets. Of late, such has been the bearish sentiment extreme on the US Dollar that there has been frequent chatter in the establishment media that it is now the Dollar and not the Yen that is the carry currency. Considering that the interest rate on the Dollar is 1% and the Yen is set at .1% this would seem to be ultra bearish nonsense just on the face of it. Yet, until Friday the action in Yen market did leave room for speculation about the ongoing role of the Japanese currency in the world marketplace. Let's look at the chart:
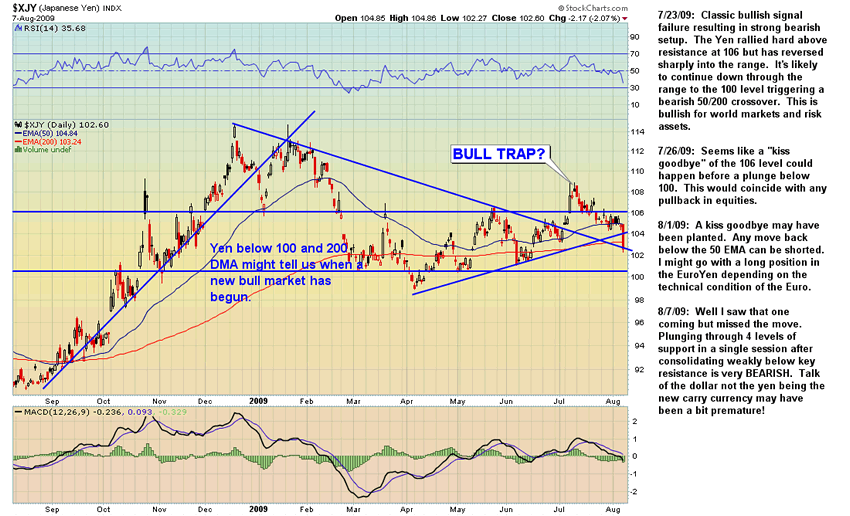
We can see that after spiking during the liquidity crisis as carry trades were covered en masse, it has since consolidated in a range between 106 and 100 with a slight upward bias. The chart has certainly been open to various interpretations. On Friday the Yen crashed through four levels of support and is likely to have begun a new bear market signaling the onset of the Yen carry trade anew. The spike to 109 in July remains as a clear Bull Trap and a selling opportunity. So, apparently traders will not be selling the Dollar against the Yen as a carry trade! And the US economy is not likely to be the new Japan. Now let's have a look at some long term charts of USDJPY.
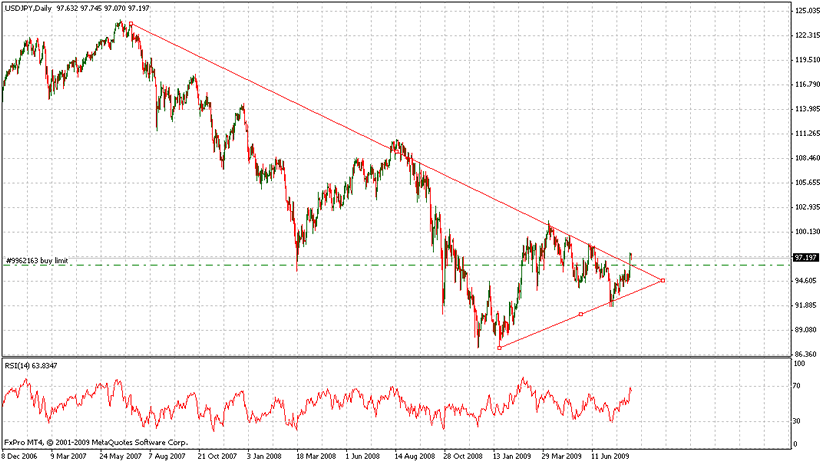
The first chart above is a long term daily of USDJPY. There has been a clear breakout of a long term downtrend that dates back to March of 2007 or the time when the SPX was putting in a top as well. We also see a clear triangle bottom formation. The trend break was clean and hard and came on a run up from well below the downtrend line which is suggestive of a decisive break. The market is making a definite statement here.
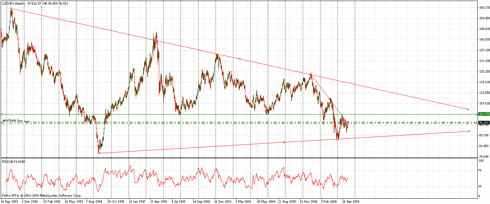
The second chart is a long term weekly of USDJPY. We can see that a long term higher low has been put in and the chart is set up to run back to the upper return line of a long term triangle formation.
The chart of the USDJPY is a picture of the relationship between the world's official carry currency and the world's official reserve currency. It is significant and any major breakout is very important.
I cannot claim to have an exact handle on what these pictures are telling us. But it would seem to be very bullish for the US dollar to be putting in a bottom and breaking out against the second most important component of the US Dollar Index and the world carry currency.
The EuroYen broke out on Friday, however given the possibility of relative European weakness in comparison to the US, I think that selling the Yen against one of the commodity currencies--or the US Dollar--would be the new carry trade. So in effect, the carry trade may in fact now be the exact diametrical opposite from the ultra Dollar bearish scuttle being bandied about in the financial news media in recent weeks!
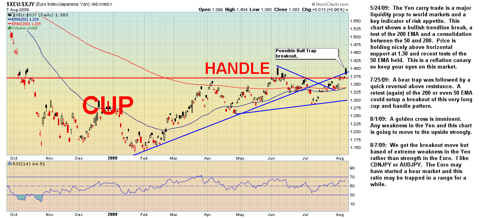
Here are the charts of the Yen against the CAD and NZD:
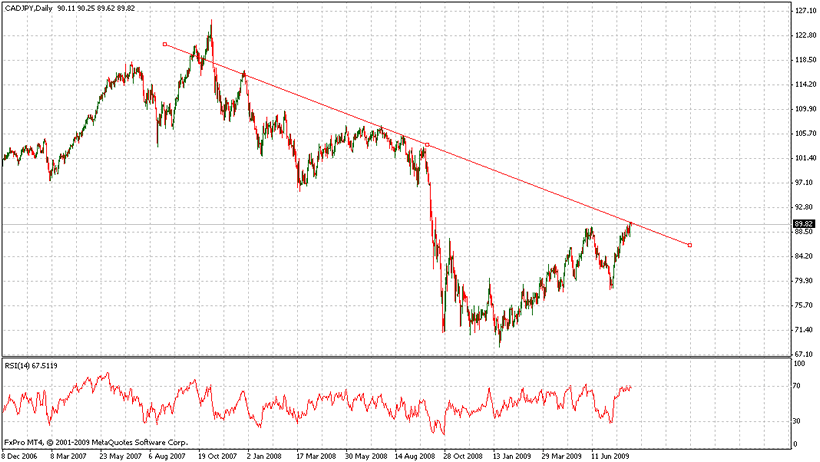
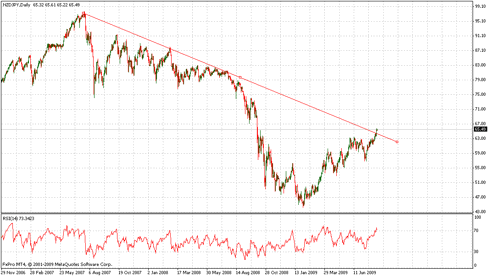
I feel a bit like Richard Dreyfuss in "Close Encounters of the Third Kind" where
he is toying with his mashed potatoes and pondering their shape and says
"This means something...It's important".
I don't yet know what it means, but like Richard I am going to find out! Any ideas?

Long USDJPY
Please do comment on this article. A lot of hard work goes into preparing this report and it's good to know that someone is reading it and hopefully benefitting from it!
By Steve Vincent
The BullBear is the social network for market traders and investors. Here you will find a wide range of tools to discuss, debate, blog, post, chat and otherwise communicate with others who share your interest in the markets.
© 2009 Copyright Steven Vincent - All Rights Reserved Disclaimer: The above is a matter of opinion provided for general information purposes only and is not intended as investment advice. Information and analysis above are derived from sources and utilising methods believed to be reliable, but we cannot accept responsibility for any losses you may incur as a result of this analysis. Individuals should consult with their personal financial advisors.
© 2005-2022 http://www.MarketOracle.co.uk - The Market Oracle is a FREE Daily Financial Markets Analysis & Forecasting online publication.


