


Stock Market Cycle Turning Points Analysis 17th June 2007
Stock-Markets / US Stock Markets Jun 17, 2007 - 05:51 PM GMTBy: Andre_Gratian

Current Position of the Market.
SPX: Long-Term Trend - The 12-year cycle is still in its up-phase but, as we approach its mid-point some of its dominant components are topping and could lead to a severe correction over the next few months.
SPX: Intermediate Trend - With the price reaching the preferred target area in an appropriate time frame, the rally from 3/14 should be coming to an end very soon.
Analysis of the short-term trend is done on a daily basis with the help of hourly charts. It is an important adjunct to the analysis of daily and weekly charts which determines the course of longer market trends.
Daily market analysis of the short term trend is reserved for subscribers. If you would like to sign up for a FREE 4-week trial period of daily comments, please let me know at ajg@cybertrails.com .
Overview
The stock market rode a roller coaster in the past two weeks. Two weeks ago, the SPX had a 3-day
drop of over 53 points, but after stabilizing, it headed in the other direction and on Friday had
retraced all but 2 points of the decline. All indices behaved similarly with the Nasdaq 100 making a
new bull market high by a slight margin.
This index gave a clue that the decline might not follow through. While the SPX broke below some short-term lows, thereby reversing its pattern of higher highs and higher lows, the NDX did not proving once again its value as a leading indicator. Now that it has made a new high, it is inviting the SPX to do the same. However, as we will see under "Projections", it is very close to an important Fibonacci target which could mark the end of its run. The SPX is also approaching an important projection which is a little higher than its 1540 high.
So both indices could be making new highs on this run which begs the question: Can an important market high be made when the NDX is not diverging significantly from the SPX? Yes, because of the cyclical configuration, an intermediateterm high is undoubtedly very near. But will it be a long-term bull market top as well, as some reputed analysts are forecasting? That remains to be seen. There are a number of potential scenarios which could bring this about over the next few months, but it is much too soon to discuss these at this time. The immediate focus will be on pin-pointing the exact intermediate top.
Lately, the stock market has reacted positively to comments by the Federal Reserve and economic
news. These were the trigger for the rally from the recent lows. But now, a fly in the bullish ointment
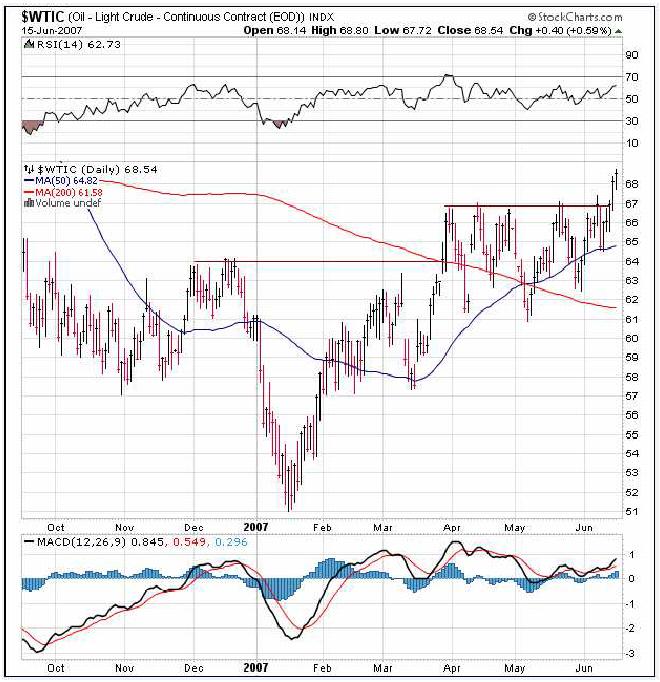
may come in the form of crude oil which, since its recent $51 low, has been climbing steadily and,
after forming a re-accumulation pattern between the low and mid-60s, touched $69 on Friday in the
July futures.
I am including a chart of crude oil continuous contract (courtesy of StockCharts). You can see how quickly the price recovered from its low and overcame the first resistance level at $64. After consolidating for a couple of months between 61 and 67, it has cleared that resistance level as well, and is now moving higher. With a break-out above 67, the Point & Figure chart of the continuous contract is now forecasting a potential move to $75. With gas prices already around the $3.00 mark and a nastier than average hurricane season predicted for this year, the energy complex could be looking at even higher prices and be one of the factors turning the bullish market sentiment to bearish very quickly.
What’s Ahead?
Momentum:
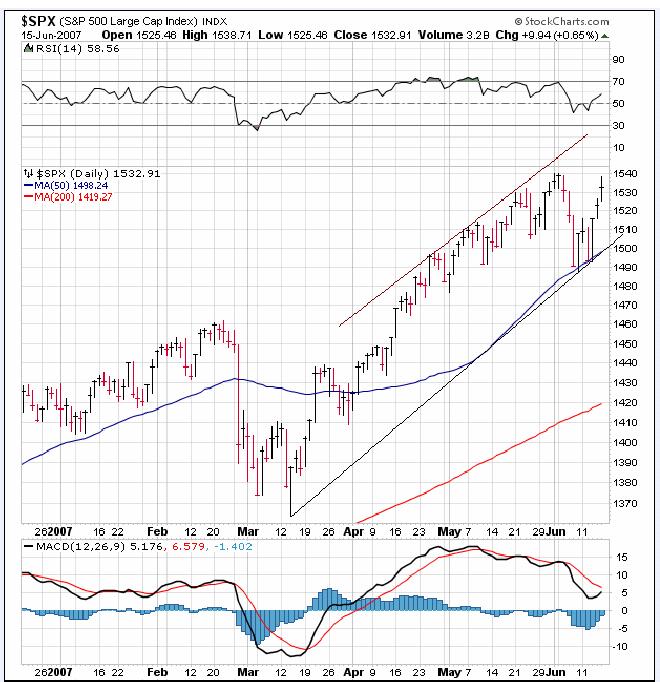
Let's look, once again, at the current chart of the daily SPX (also courtesy of StockCharts). The last
time we looked at this chart, I pointed out the increasing loss of price momentum reflected in the RSI
and MACD. While it was apparent two weeks ago, it is now flagrant and has turned from a yellow to
a bright red flag.
You can see how the decline stopped exactly on the blue 50-day MA which was (and is) still rising
along with the red 200-day. This suggests to me that whatever top is made here, will only be of
intermediate nature. It could turn out to be a major bull market high, but the stock market would
probably have to undergo a substantial period of distribution within a trading range such as the one it
made in 2000 before the major decline started.
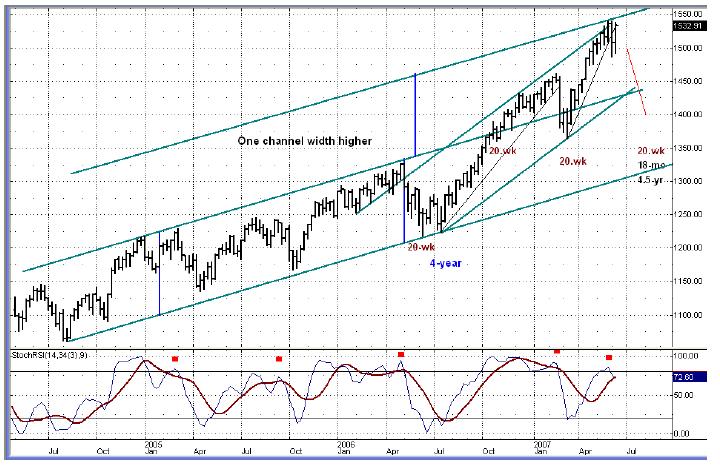
A longer-term weekly chart of the SPX clearly shows that the index is now traveling in a very broad up-channel with the lower trend line presently about 1325. But even before challenging this longterm uptrend, there is another channel within the longer one which has been rising at a steeper angle since the 4-year low of last year. This one would have to turn first. In other words, even if we were to be making a major bull market high here, reversing this trend would take some time and a great deal more distribution at the top than we have had so far.
Another interesting feature of this chart is the fact that the uptrend stopped exactly one channel width higher and that what used to be the top channel line is now the mid-point.
And finally, the intermediate momentum indicator at the bottom of the chart is now showing a clear pattern of negative divergence (similar to the daily indicators on the chart above) which is normally found at market tops.
Cycles
This, written in the last newsletter, bears repeating.
A group of cycles which are due to bottom in 6 to 8 weeks are responsible for the current slowing and, as we
draw closer, the downward pressure will intensify. Based on this expectation, I believe we should see a
market reversal to finally take place within the next 2 weeks. But we have to acknowledge the fact that the
market still has a lot of strength, and an intermediate top occurring so close to the next intermediate low is a
sign of right translation, meaning that the longer-term cycles are still in their up-phases and continue to
dominate the longer trend. Which also means that labeling the coming high as the top of the bull market as
some analysts are doing, is very premature.
We did see a top being formed just about the time of the previous writing, followed by a sharp decline. But, although we have not yet risen to a new high on the SPX, it sure looks like it wants to! A pull-back on Monday followed by a final high mid-week looks feasible.
Two Longer cycles (2-yr and 3-yr) which are sometimes responsible for bull and bear swings are in the process of topping, but it could be several months before they materially affect prices. By the time the intermediate cycles are in a position to rally later on in the Fall, the bigger cycles may begin to suppress their advance and even turn it down before new highs are reached, at least in some of the weaker indices. But I do not expect a straight path down to 2012 or 2014 as is forecasted by some of the more radical bears. I believe that, instead, we could see a prolonged period of limited range trading until early 2008, followed by weakness into the end of that year.
The above was also written in the last newsletter and needs to be repeated. In fact, the cyclic
configuration which is described above could give us the perfect set-up to form an important top,
beginning with an intermediate decline followed by a test of the highs and distribution for a period of
several months before a more severe decline. We don't have to make radical forecasts at this time;
let's take it day by day, week by week, and month by month!
Projections
When the SPX made its low in March, it made a Point & Figure base from which we could derive a
count to 1560. However, this is only on secondary projection. The primary one was to about 1540
(both P&F and Fib), and look at what happened after it was reached. Before we can get to 1560, we
will have to get above the former highs, but I don't think that we have very much time to do this. The
market cannot afford to hesitate here, or the time window of opportunity to make new highs will be lost.
From the lows made last week, we can establish confirming counts and Fibonacci projections both to 1538 and to 1560. 1538 was reached on Friday and stopped the advance. We'll see next week if it's only temporary or longer lasting.
Another measurement using another phase of last week's low gives us 1551. There is also a somewhat less significant projection to 1544. We now need to let the market choose which of these levels it wants to reach before deciding to turn down.
The NDX has a cluster of Fibonacci projections centering around 1960.
Breadth
With the recent plunge and the extremely negative A/D numbers that accompanied it, the
intermediate summation index really took it on the chin, plunging to a new low since its top in
December. The McClellan oscillator became very oversold and has now rallied to slightly above the
zero line. Of course, it shows negative divergence with price, having made a series of lower highs
and lows for several weeks now, while the SPX was in a strong uptrend.
Market leaders & Sentiment
None of the indices which act as leading indicators is showing much divergence and, as I pointed out
earlier, the NDX was the only index last week to make a new high. GE is approaching its bull market
high, but has not yet exceeded it. Same picture here: Whatever top we are in the process of making
does not appear to be a major top.
Instead of focusing on market leaders, let's instead turn to sentiment, because something interesting is happening there.
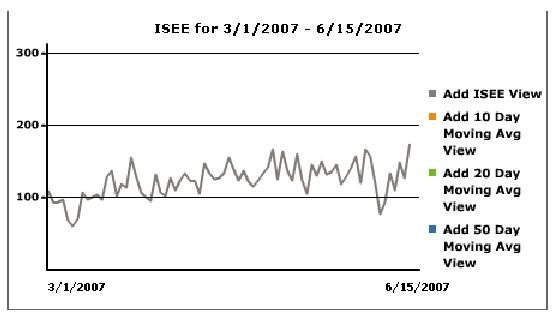
The ISEE is one of the most reliable options sentiment indices. I have posted it below, showing its
readings from 3/1 to last Friday. A low reading is bullish and a high reading is bearish. Note that at
the March low, this index was at a low level. It was also very low at the bottom of the recent 53 point
decline, calling for a rally. Now, it has risen to its highest level since March -- another independent
sign that the market is at a top.
Summary
All signs are pointing to an imminent intermediate market top which should bring about a decline of 5 to 8 weeks. This top could come as early as next week.
A market advisory service should be evaluated on the basis of its forecasting accuracy and cost. At $25.00 per month, this service is probably the best all-around value. Two areas of analysis that are unmatched anywhere else -- cycles (from 2.5-wk to 18-years and longer) and accurate, coordinated Point & Figure and Fibonacci projections -- are combined with other methodologies to bring you weekly reports and frequent daily updates. The following are examples of unsolicited subscriber comments:
What is most impressive about your service is that you provide constant communication with your subscribers. I would
highly recommend your service to traders. D.A.
Andre, You did it again ! Like reading the book before watching the movie! B.F.
i would like to thank you so much for all your updates / newsletters. as i am mostly a short-term trader, your work has
been so helpful to me as i know exactly when to get in and out of positions. i am so glad i decided to subscribe to turning
points. that was one of the best things i did ! please rest assured i shall continue being with turning points for a long while
to come. thanks once again ! D.P.
But don't take their word for it! Find out for yourself with a FREE 4-week trial (above).
By Andre Gratian
MarketTurningPoints.com
If this information is of value to you, you should consider our trial subscription offer (above). Daily updates consist of a Morning Comment, Closing Comment (which occasionally includes an updated hourly chart of the SPX to illustrate the analysis), and at least one or more updates during the trading session whenever it is warranted by market action. These updates discuss phase completions, give projections, potential reversal points, and whatever else may be pertinent to the short-term trend.
“By the Law of Periodical Repetition, everything which has happened once must happen again, and again,
and again -- and not capriciously, but at regular periods, and each thing in its own period, not another’s, and
each obeying its own law … The same Nature which delights in periodical repetition in the sky is the Nature
which orders the affairs of the earth. Let us not underrate the value of that hint.” -- Mark Twain
You may also want to visit the Market Turning Points website to familiarize yourself with my philosophy and strategy.www.marketurningpoints.com
Andre Gratian Archive |
© 2005-2022 http://www.MarketOracle.co.uk - The Market Oracle is a FREE Daily Financial Markets Analysis & Forecasting online publication.