


Major Financial and Commodity Markets Turning Point Dead Ahead (Part I)
Stock-Markets / Financial Markets 2009 Aug 31, 2009 - 10:53 AM GMTBy: The_BullBear

Major Financial and Commodity Markets Turning Point Dead Ahead (Part I)
 A Transitional Period in Intermarket Relationships Will Likely Give Way to New Secular Trends
THE BULLBEAR MARKET REPORT
A pullback to support in equities is likely and could set up a long term buying opportunity. The US Dollar has begun a stealth, technical Bull Market. The Bull Market in commodities is arguably over.
SUMMARY
Since the last BBMR on August 7th, the equities markets have continued a nearly vertical ascent. The move has come on declining volume and chart formations tend to suggest exhaustive topping action. Fundamentally, the economic data has generally improved and earnings have exceeded expectations in most sectors. Commodities markets have notably underperformed equities and are showing technical signs of a top that may be long term in nature. Technically, equities markets have acheived a sustained golden cross as the 50 EMA has crossed above the 200 EMA. Notably, the CRB index has failed to acheive this important technical hallmark of a bull market. Intermarket relationships (Dollar :: Equities, Dollar :: Commodities, Equities :: Commodities, Yen :: Everything...) are showing marked signs of change and transformation to new secular trends which suggests that the current period may be described as transitional in nature.
The author's expectation continues to be that the fundamentals will continue to show gradual improvement, that concerns about sovereign debt and the global economy will continue to play out as bricks in the classic "Wall of Worry" and the markets will manifest this with a continuation of the bull trend after a pullback to support and a period of consolidation. On the other hand, there are still major, structural forces at work in the markets and the world economy which could effectively neutralize the massive reflationary forces unleashed by fiscal and monetary policy leading to a bearish resolution.
The short term picture is overbought and some pullback is likely after the strongest month since the bull run began in March. Of late, sentiment has skewed too far to the bullish side to support a continued advance. Traders and investors are invited to consider planning a long entry but advised not to chase the market higher. Patience will be rewarded.
My current equties market stance is: short term bearish, intermediate term neutral to bullish and long term bullish. My current commodities market stance in all time frames (with particular emphasis on the Precious Metals sector) is BEARISH. My position in all time frames (save the immediate term) on the US Dollar is BULLISH. Note that this is a significant change in market posture from the last report. The reasons for this shift are detailed herein.
FUNDAMENTAL ANALYSIS
Since the last BBMR, the markets have passed through earnings season and generally received corporate reports with approval. Economic reports have tended to indicate an end to the recession is nigh. Markets may have already have priced in these factors.
The primary fundamental in an economy based on a fiat debt monetary system is the flow of liquidity. Regardless of one's philosophical leanings, the fact remains that our capital markets and indeed the entire US economy is not much more than a Ponzi scheme. It relies entirely upon the ability and willingness of the next party to go into debt to support the already existing indebtedness. It's simply a matter of supply and demand.
At this juncture massive forces of inflation and deflation are seeking resolution. Heretofore unimaginable monetary inflation and fiscal stimulus may, for a time, reflate asset prices in spite of deep structural issues in the real economy which may be so profound as to render such inflation ineffective.
The foregoing notwithstanding, it is possible that the US and global economies are about to embark on an epoch of unprecedented real growth based on emerging economy development and technological revolution in developed economies. The current view of the author is that the technical story being told by the markets in the charts favors this scenario. The neo-luddite "total collapse" hypothesis is likely a red herring. Keynsian and fiat monetary policy will likely foster yet another massive debt-based bubble. If the bubble results in the emergence of vital new growth industries in the real economy then the end result may be pleasant enough; if no such real growth emerges, then the resulting debt bubble will likely end in an even more catastrophic replay of the recent financial and economic debacle.
On a long term basis, I see two possible trajectories for the US economy and equities markets. One the one hand, a temporary reflation of asset prices resulting from monetary and fiscal debt accumulation leading to phantom economic growth which ends badly in a sovereign debt crisis and the collapse of the US dollar. In such a scenario further reflationary schemes spark hyperinflation, a commodities mega bubble and a collapse in risk assets. I'd put that at about 18-36 months out in time. A more optimistic scenario finds much of the new liquidity actually being invested in new growth industries which spark real economic expansion, generate millions of new high paying jobs and create the wealth necessary to the paying down of the nation's debt burden. Such a scenario would necessarily be led by America's one remaining competitive advantage: technology. It has been more than fifteen years (a century in terms of Moore's Law) since the personal computing and internet revolutions. The economy is long overdue for a new technological revolution which may be imminent. The vast outperformance of the Nasdaq 100 over the broad market may very well be forecasting just the technological revolution I am suggesting. I do not yet know which specific sectors or companies will be the epicenters of such a development, but I strongly suspect that Green Technology will be one sector which will be at the forefront of such a revolution.
Regardless of the outcome of the general economic environment, I believe that volatility is now the new normal in the markets. We have seen 20-50% moves become more common and of shorter duration and this is a pattern which will continue as long as fiat monetary expansion refuses to allow normal economic and debt corrections to occur. In fact, since central banks and governments persist with Keynesian monetary and fiscal management and manipulation (and there is no sign that they will ever change course), inflation will be reflected in wider and more dramatic swings in asset prices than ever before. Just as the Crash of 1987 now appears as a mere blip on an arithmetic chart today, so may the Panic of '08 appear on future charts.
I think that to continue to apply the term "Markets" to the systems of price settlement that we now associate with the term is a misnomer and a falsehood. We no longer have equities and asset markets. True markets require a method of price discovery based on supply and demand and a reliable unit of measure. A monetary unit should be both a means of exchange and a store of value. The existing worldwide fiat monetary regime only provides for the former. The fiat monetary unit of measure does not store value since its supply and demand is not a function of supply and demand itself but rather of policy on the part of central bankers and governments. Price discovery then becomes unstable and unreliable. Since value cannot adequately discover price it cannot remain as money for any length of time and it is driven to seek return. A constant and exponential expansion of money supply leads to the requirement that value constantly seeks out speculative gain. Value has no safe haven and is tossed upon an increasingly violent sea. This translates into larger and faster swings in asset prices. Under true market conditions, where the monetary unit is a reliable measure and store of value and there is relatively confident price discovery, value seeks investment in productive economic activities first and in speculative returns second. In short, we are bound by the very nature of the existing regime to see massive and frequent price swings across the board for the foreseeable future. Instability and volatility is the new normal. Financial survival dictates that investors must learn to trade these swings and as they do this will, of course, accentuate the volatility. Hold times of 6-18 months may become long term investments. I hope to expand upon this critical theme at a later date.
SENTIMENT
The "Wall of Worry" which all bull markets climb is intact, however, of late there are indications that a bullish consensus has taken hold. In a very short period of time, a solid majority of reports on CNBC or Bloomberg on any given day have turned complacently bullish. A review of popular blog and guru sites finds few posts calling for a correction or a top with the usual bears strangely silent.
The Investors Intelligence Sentiment Index is at 51% bullish this week, its highest level since December 2007. Its bearish percentage is just 19.8%, its lowest level since the market top in October, 2007. AAII Sentiment Survey results remain skewed to the bearish side with 48.54% Bearish, 33.98% Bullish and 17.98% Neutral.
Here's a chart of the Put/Call Ratio:
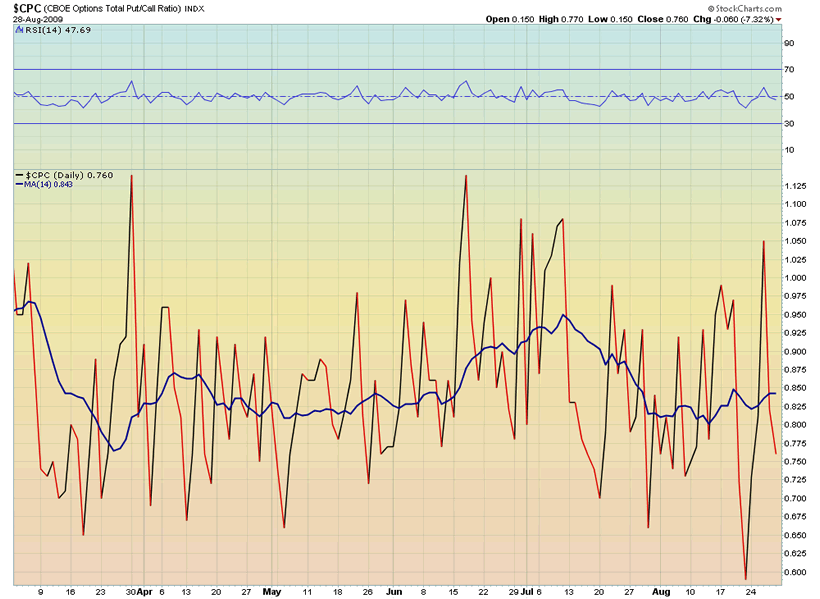
We can see that the PCR recently reached its lowest, most bullish reading since the onset of the bull trend in March. The 14 day MA is currently trading in a range similar to that preceding the May-June decline.
Larry MacDonald compiled the following sentiment data points:
From TrimTabs Investment Research:
* selling by U.S. corporate insiders in August surged to $6.1 billion, highest amount since May 2008; the ratio of insider selling to insider buying hit 30.6, the highest level since TrimTabs began tracking the data in 2004
* rally supported by short covering — short interest on NYSE stocks plummeted by 10.3% in the second half of July
From David Rosenberg of Gluskin Sheff:
* signs of buyer fatigue appear to be emerging as signaled by the stock market’s lukewarm reception to recent good news (increases in house prices/sales, durable orders, and consumer confidence)
* 50% gain in the S&P 500 since March has market trading at 130 times trailing (reported) earnings
Altogether, the indications are that bears have substantially (though not totally) capitulated and that weak sideline money and momentum traders have been chasing equities higher and higher. From a contrarian perspective, this is not supportive of a continued, healthy uprend in the near term.
Jesse Livermore pointed out that the news of the day is not important, it's the market's reaction to the news which matters. Until recently, the market has followed a pattern of reacting in a muted and temporary fashion to bad news and to rally strongly on good news. Of late, we have seen a consistent and increasing pattern of rallies on good news being sold immediately. Yes, there have been buyers on the dip. But should less than positive news emerge such buy support may be found missing.
The VIX (Volatility Index) appears to be forecasting a top in the market as well:
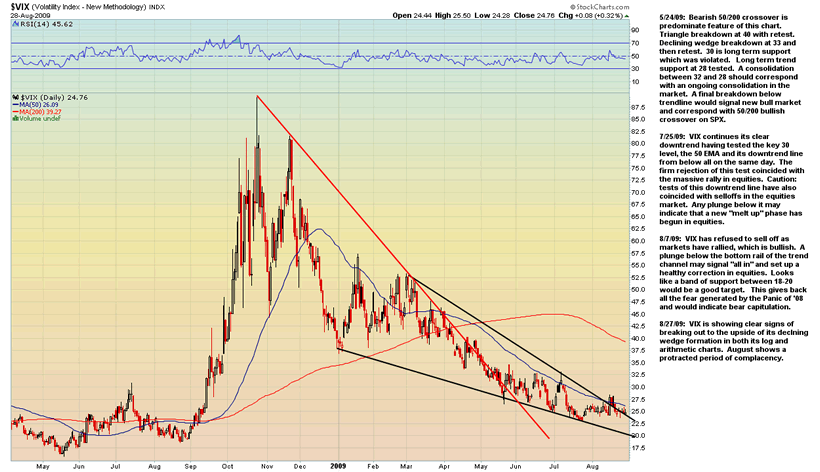
This appears to be a market that is bottoming. August shows a protracted period of nearly uninterrupted complacency, the only such period since the March bottom. The chart may be forecasting a spike in fear which would, of course, correspond with a decline in equities.
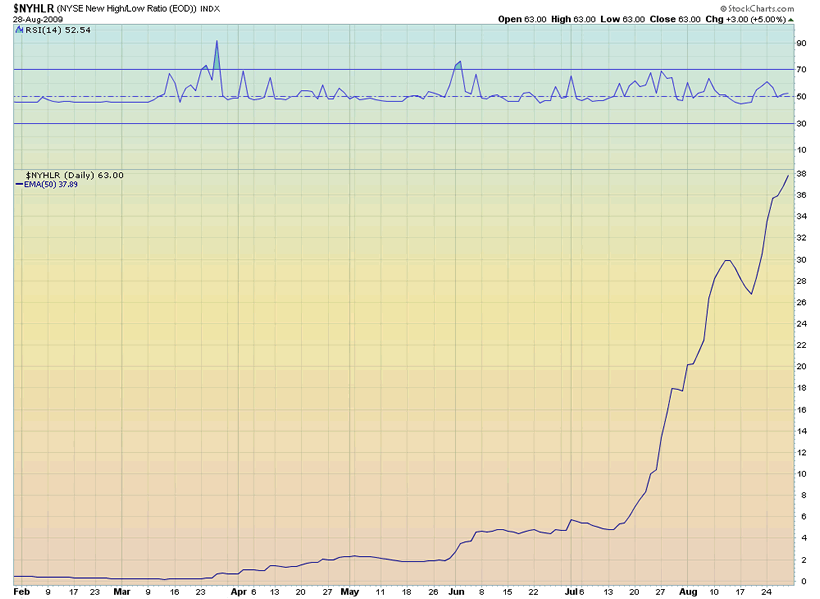
The 50 EMA of the ratio of NYSE New Highs to New Lows has clearly spiked massively in the July-August rally. Whether this represents a potentially overbought near or intermediate term condition is unclear. A similar spike was seen prior to the early 2004 multi-month pullback after the 2003 bottom.

MARKET ANALYSIS
In the last BBMR, I noted that the salient chart feature across the board was the developing relationship between the 50 and 200 day EMA. I noted that this relationship signaled a transitional period which is almost always characterized by a period of trendless volatilty. That period is now behind us and has completed with a sustained bullish 50/200 EMA cross. There should be some pullback or consolidation of recent gains however.
A survey of the charts at this time shows that across the board the 50 EMA has crossed 200 EMA. Most index charts are showing a fresh breakout to new highs following a false breakdown produced in the environment of a low volume pullback, a classically bullish technical formation. Certain internal non-confirmations of new price highs are beginning to emerge however; for example, the charts of individual leading stocks are beginning to diverge from the broad markets. Also, many markets are showing that price is now trading below the primary uptrend line established in the early stages of the rally and that pronounced bearish rising wedges have formed on declining volume. There are strong indications that this setup will produce a bearish resolution, at least in the short term.
The commodities markets have traded essentially sideways while the equities markets have advanced strongly. This gives pause to the suggestion that liquidity rules the waves and that the inflation/reflation trade hypothesis is valid. In particular, the precious metals and energy sectors are showing potentially bearish configurations. This may not be a good time to get long of commodities. There is even an argument, presented below, that the bull market in commodities is over.
In spite of common wisdom to the contrary, the chart of the US Dollar Index and its major currency pairs indicate that the greenback is at or near an important low, quite possibly even a secular bear market low. This would, of course, run contrary to an ongoing commodities bull market.
If an environment of stable or declining commodities prices, a rising dollar reserve currency and rising equities prices is technically forecast by the charts, then the resulting fundamental hypothesis shifts from an asset bubble driven by inflation to a scenario of substantive real economic growth both in the US and globally.
INTERMARKET ANALYSIS and COMMODITIES
At this time many long established intermarket relationships are showing signs of shifting. After the most significant shakeout in 80 years, the likelihood for major realignment of market forces is very high. What are those changes and how long before new, tradeable secular trends emerge?
The Short Dollar-Long Equities trade is weakening as the stock markets have forged ever higher while the dollar remains in a consolidative and possibly bottoming phase. Of late the dollar has failed to tumble as equties have surged and has on occasion risen together with stocks. Charting a ratio between the US Dollar Index and the S&P 500 yields some revealing results. One might conclude that Short Dollar-Long Equities is no longer working.
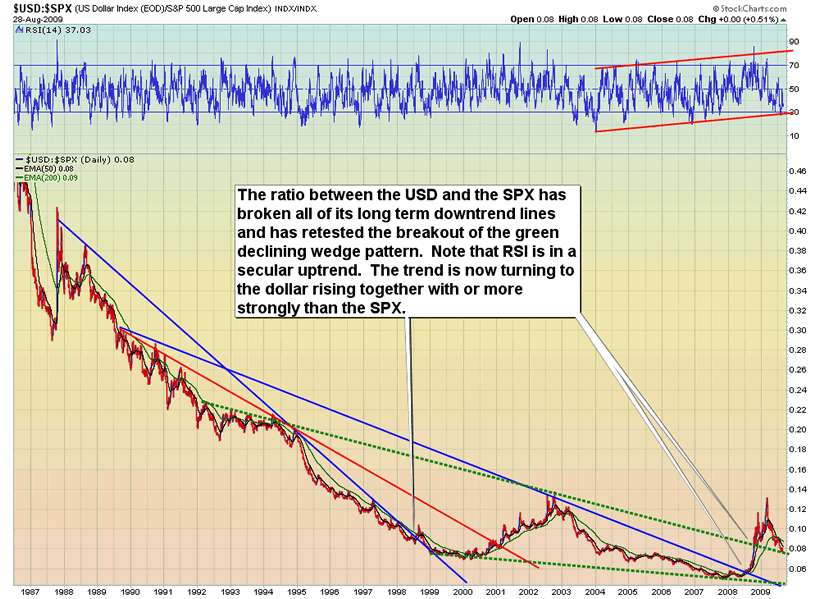
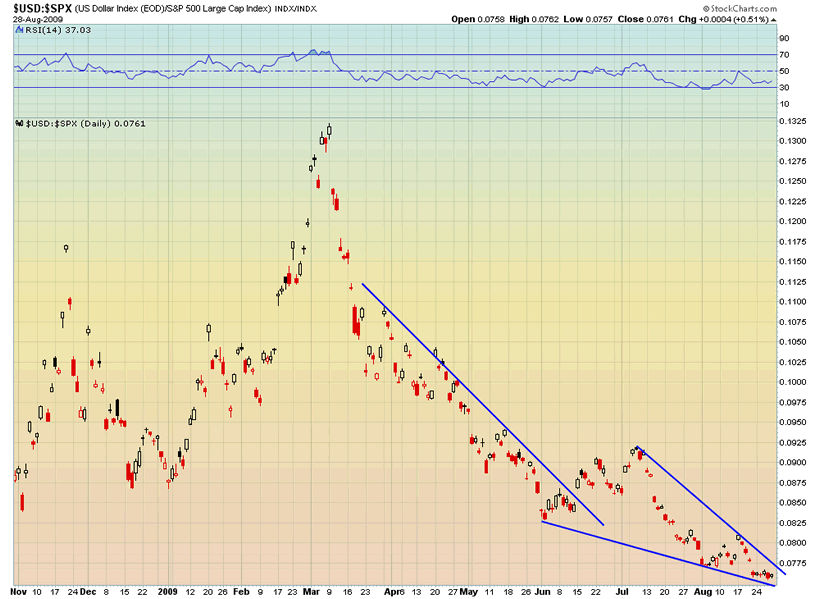
Objectively, this ratio is showing a secular turn has occured out of a very long term bottoming process and that turn is being backtested right now. A break out of the very short term falling wedge may be the catalyst for a substantive trend initiation.
What about the Short Dollar-Long Commodities trade? Let's have a look:
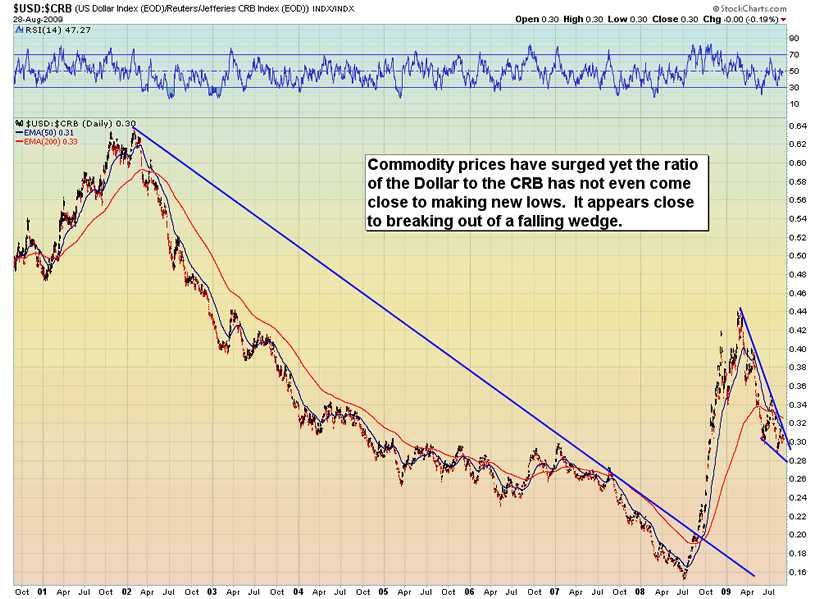
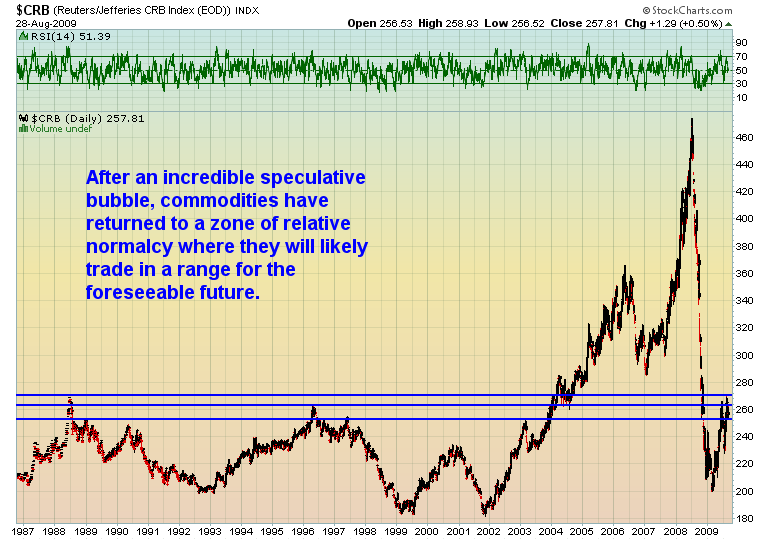
There appears to be a strong setup for a higher low in the relationship between the Dollar and the CRB. A break lower is possible but if we look at the charts of CRB and Crude Oil we find them in topping formations.
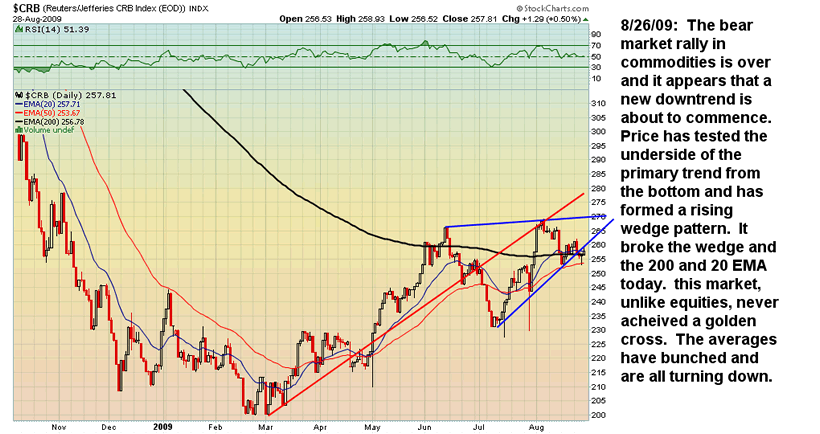
Objectively these are charts of a market that is now in a bear trend after a speculative bubble. The near term and long term for CRB is sideways to down.
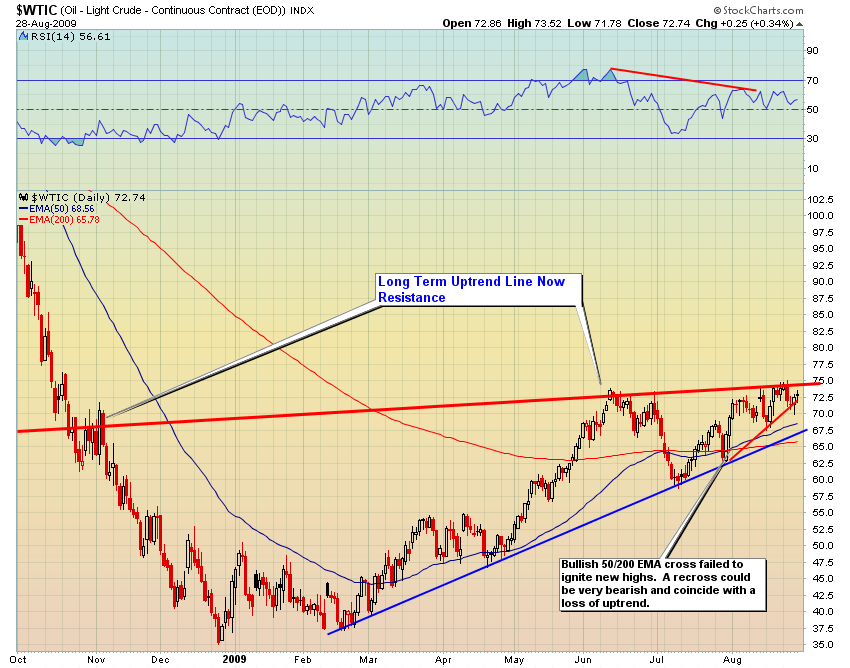
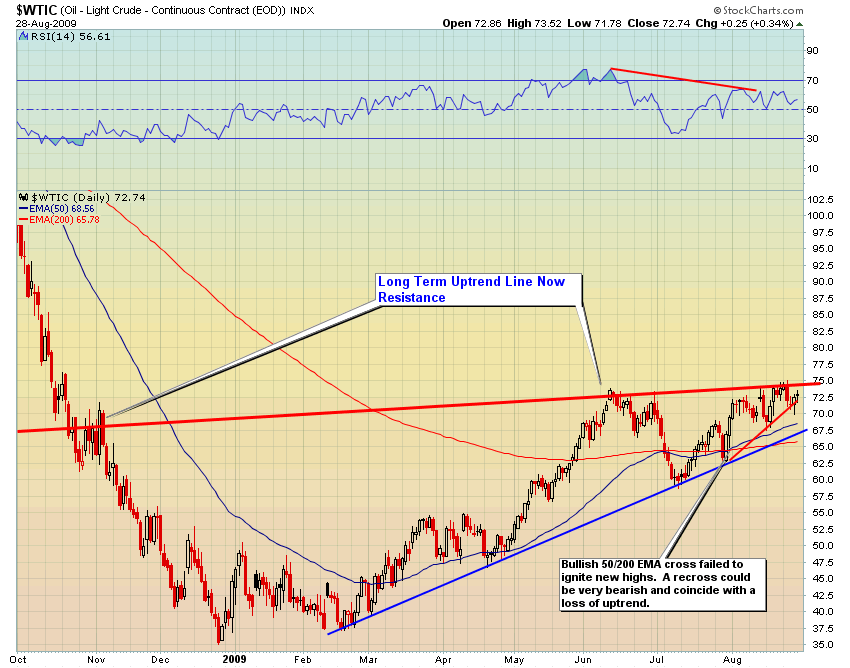
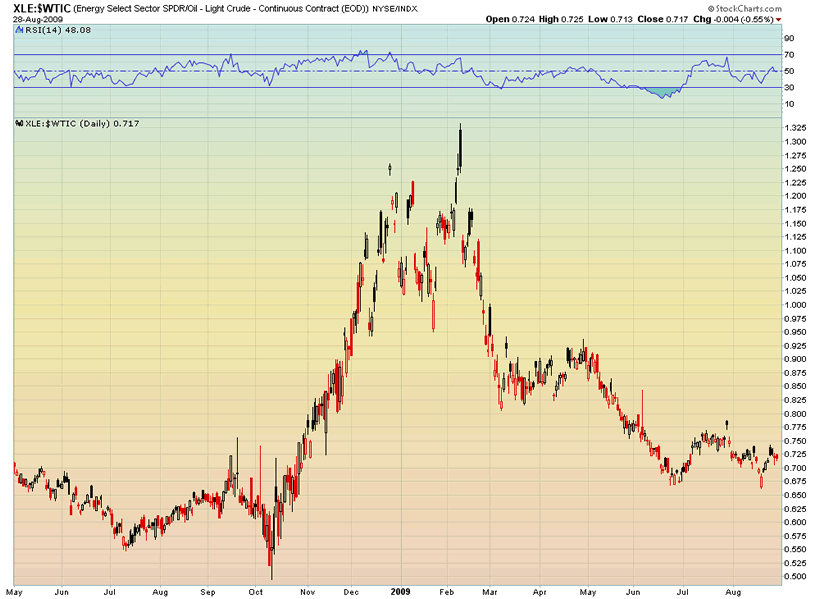
Could crude oil break out from here? Sure. But it is trading up against its long term uptrend line which has rejected price three times already. RSI is in a downtrend. Equities have made much higher highs but crude oil has not.
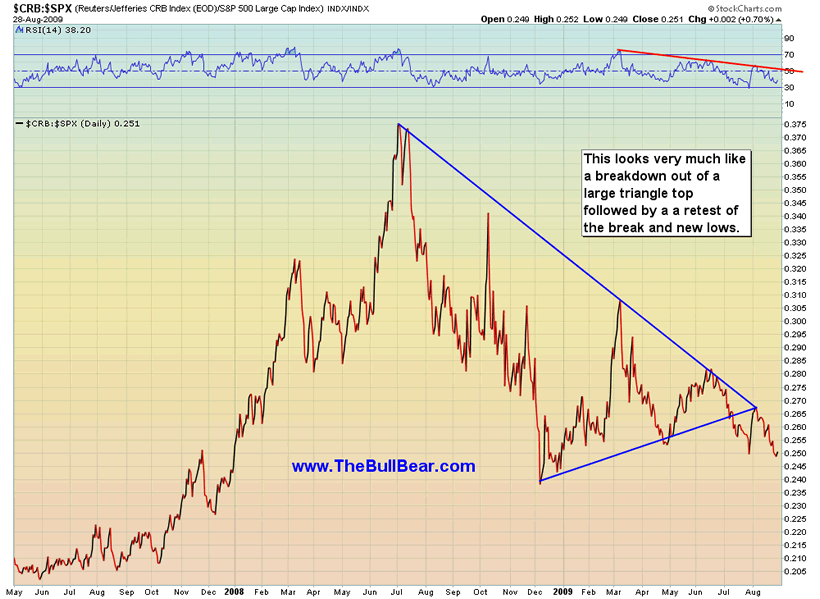
Even after the massive money printing by central banks and Keynsian spending by governments worldwide that we have seen in the last year commodity prices are not keeping pace with equities. While stocks continue to surge higher, commodities are lagging, particularly since June. The CRB: SPX ratio is showing a definite bear trend.
I believe in gold and silver as money and an asset backed currency. I would like to see the precious metals soar "to da moon" for both political, economic and personal financial reasons. Yet I become increasingly sceptical that this will happen. My sceptics corner is also very lonely as there are few who question the "inevitablilty" of a gold pandemic. As a contrarian, this is a further cause for concern. That Wall Street and CNBC have been pumping gold for the better part of a year is even more troubling.
Gold has gone absolutely no where as the rest of the commodity complex and equities have surged in spite of the greatest financial crisis since 1929 and the most awesome monetary inflation since the Weimar Republic. The precious metal also went public as television, radio and print ads for gold swamped the media from the Superbowl forward until very recently when they went dark. Everyone who could possibly want to be in gold has been brought into the trade. If you were to review the blogs and postings of die hard gold bug analysts you would find that they have all opined at one time or another that when the public is widely involved in gold that that would be the top. Well this has happened...and without a commensurate bubble run in the metal. Yet there is strange silence on this major contrarian signal.
One might also contemplate that gold has enemies in the highest of places with the ability to sell phantom metal into the COMEX at will. They wouldn't dump the market when it's at its most vulnerable, would they?
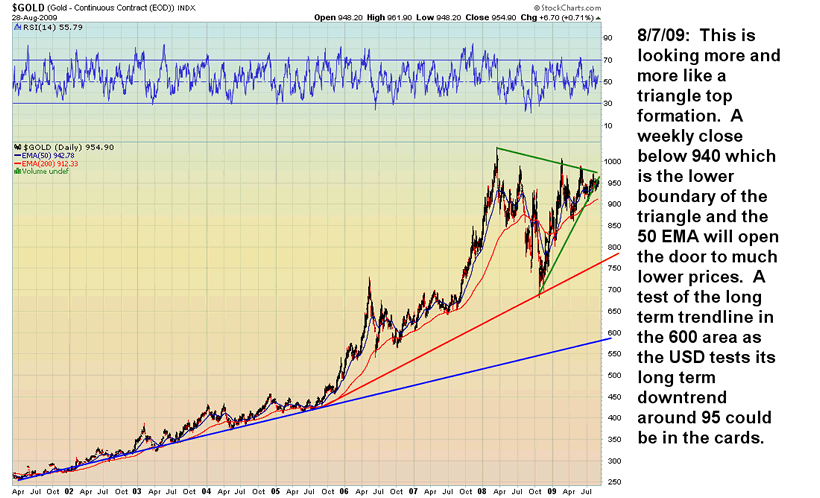
The long term chart shows a massive triangle top. Compare the chart of gold below to the chart of copper before its bubble burst. They look very similar. Gold investors should consider at least hedging their position until a breakout of 1000 is successfully backtested. Could gold break out from here? Sure it could. And it could be a bull trap as well.
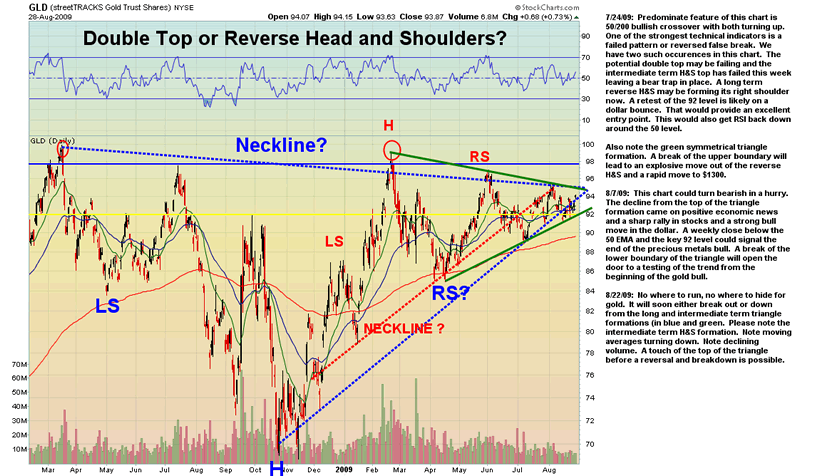
Many are seeing a reverse Head and Shoulders formation here but do not question that a bottoming formation does not generally form at a top! They don't tend to see the shorter term H&S topping formation (in red) from which price has already broken down.
Gold bugs tend to look for precious metals equties to outperform gold prior to and during the initial stages of a bull move in the yellow metal. Let's see what's happening with that ratio:
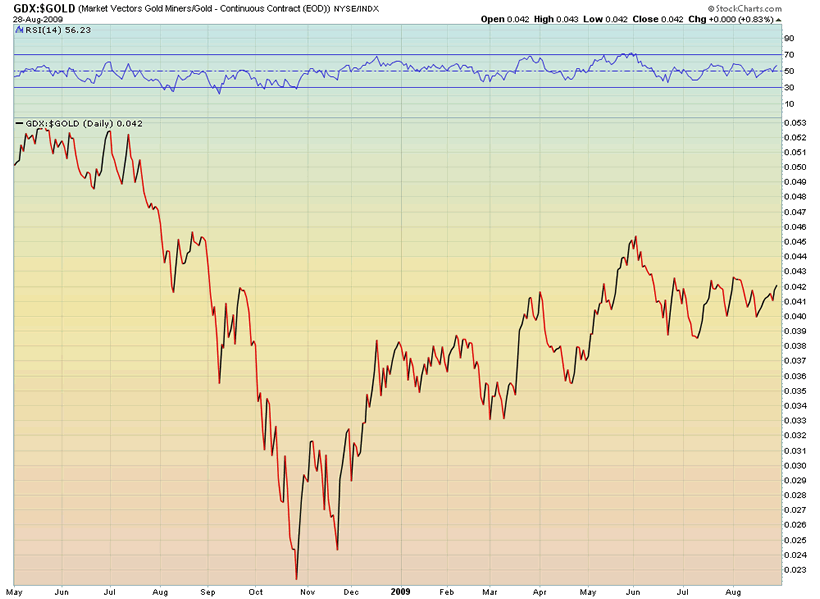
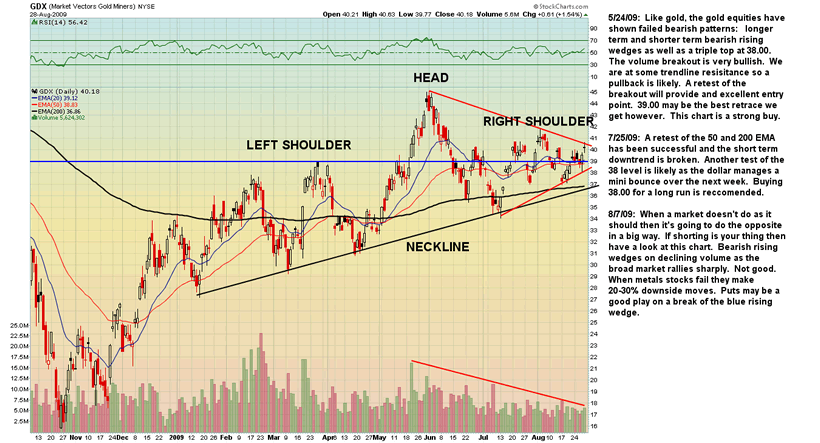
There's nothing inspiring to holders of gold here. Gold equities have been underperforming the metal since June. We can note however that the gold mining equities have gone absolutely nowhere while the broad market has rampaged higher and higher. A head and shoulders top formation could be in play. If you are long this sector with no stop in place you are playing with fire. Could a breakout be near? Sure.
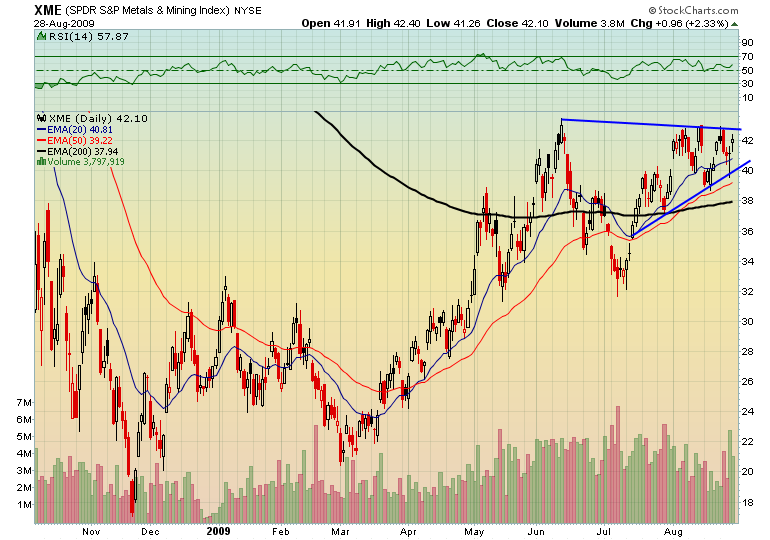
The Metals and Mining ETF shows a similar dramatic underperformance and topping formation.
The resemblance between the copper top and this gold chart is eerie. We can only hope that a break in gold is not as catastrophic as the break in copper.
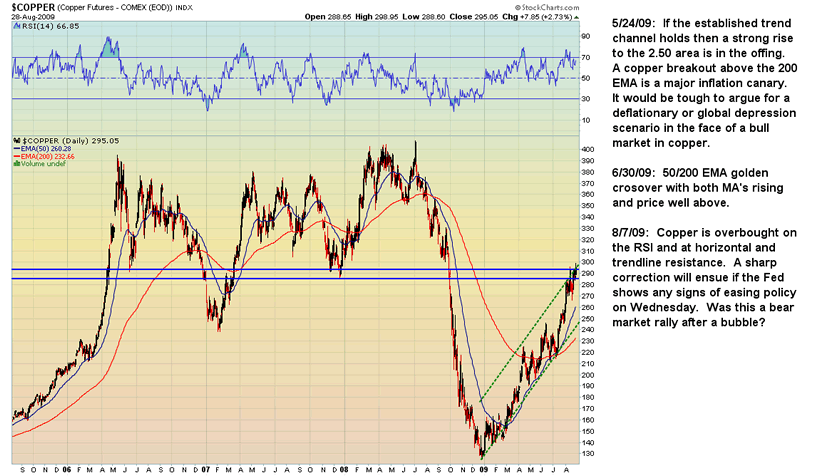
Copper is now retesting the break of its long term bull market trend line and horizontal resistance as well as the top of its channel from the late 2008 bottom. If it were able to break higher here then it would be a powerful signal that major price inflation is in the cards.
Silver gives further weight to the notion that the commodities bull market is over and that a sideways to slightly downwards trade will take hold:
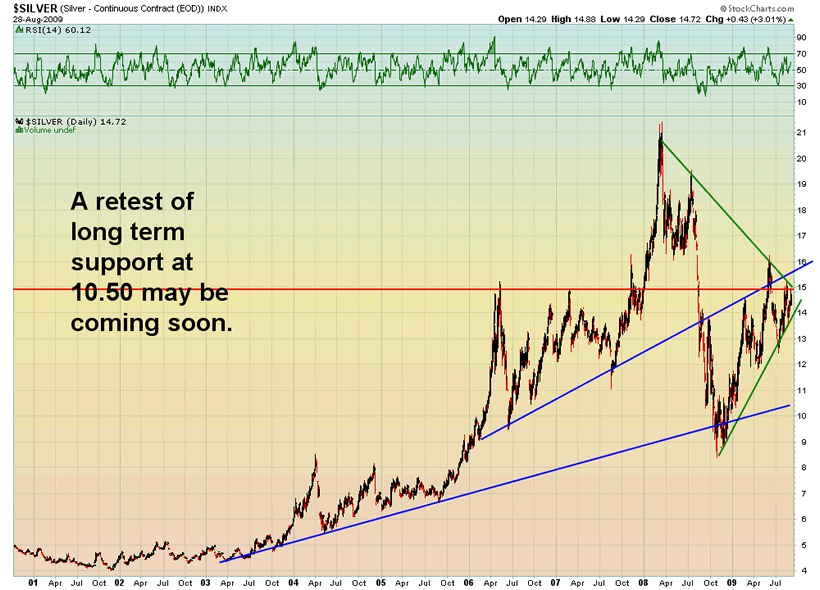
Silver like gold is approaching the apex of a large triangle. There is horizontal and trendline resistance directly above. The precious metals are nearing the decison point.
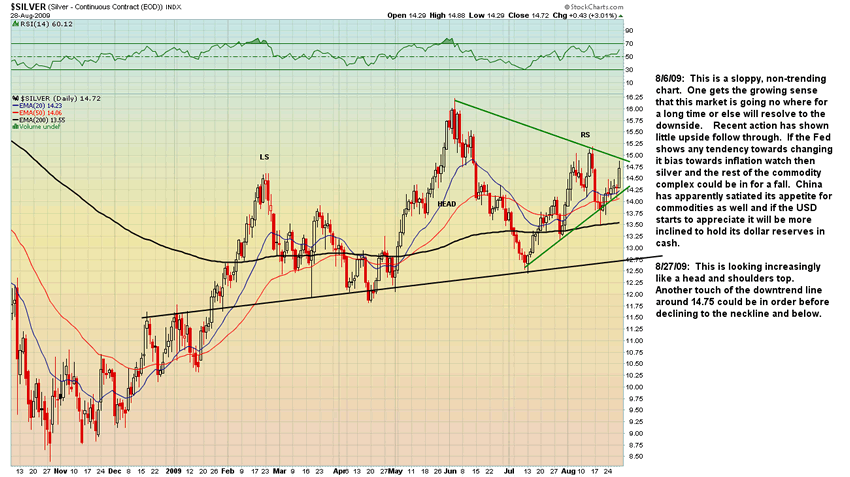
On an intermediate term basis, silver is carving out what apperars to be a head and shoulders top. A break out of the green triangle is certainly possible but be wary of a bull trap.
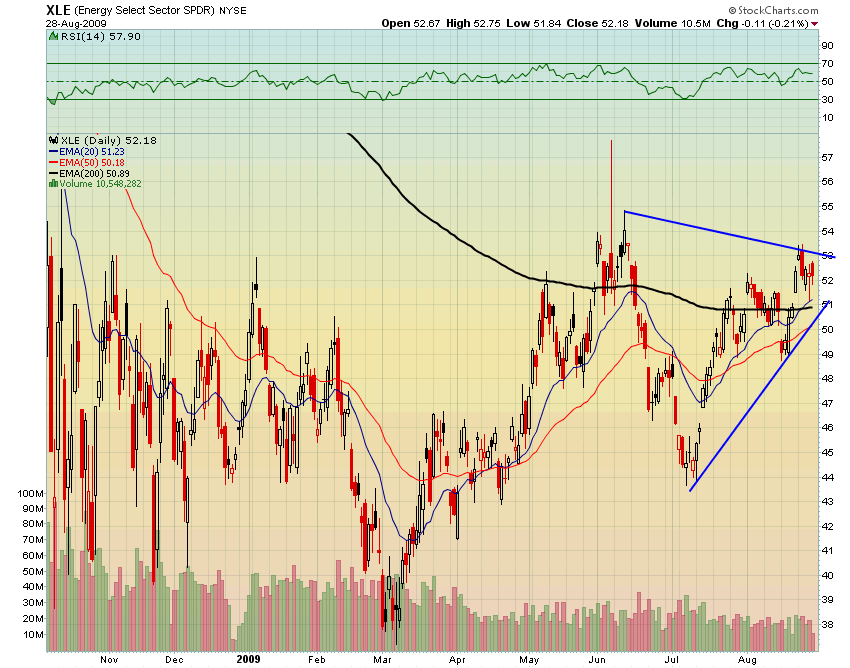
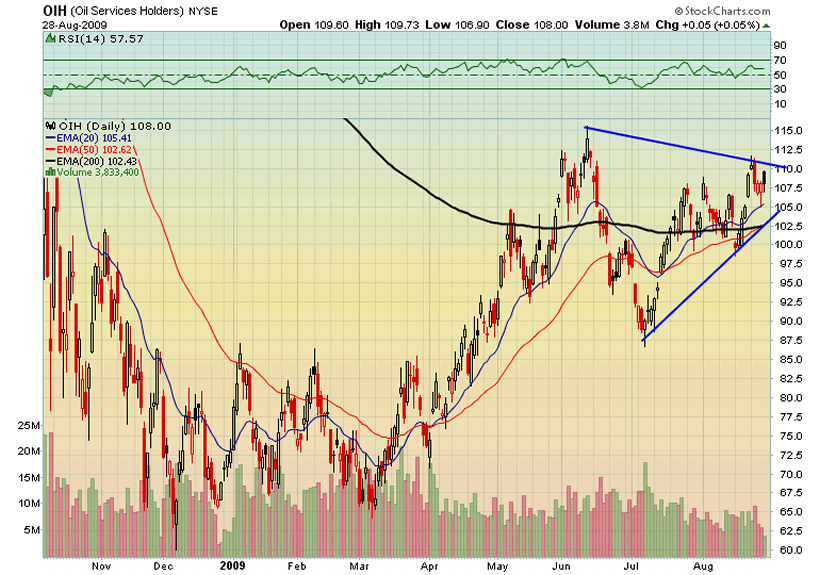
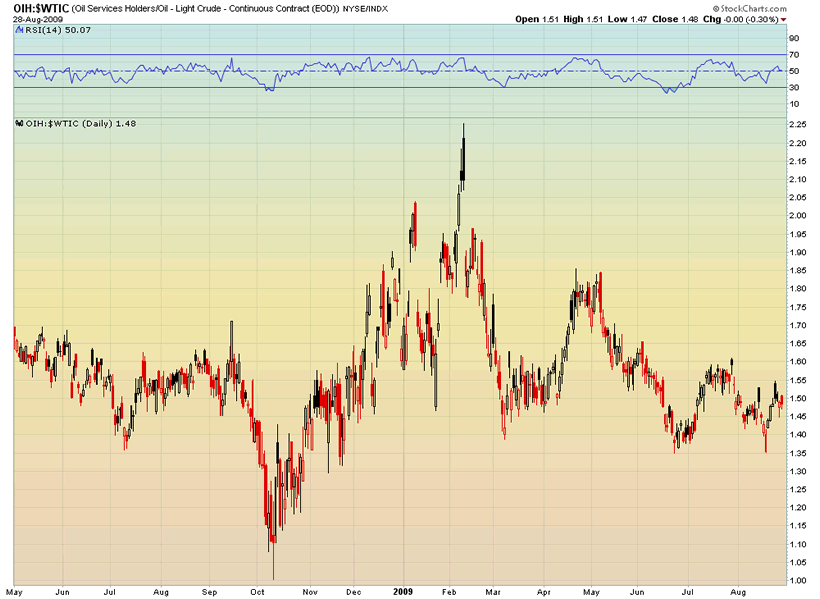
Like GDX and the Metals and Mining ETF, the Oil Sector and Oil Service ETF's have gone nowhere as the broad markets have rallied sharply. They have also vastly underperformed the price of crude oil. What does this say about the future of commodity prices?
COMING SOON....PART II with analysis of the Currencies and Equities Markets.
By Steve Vincent
The BullBear is the social network for market traders and investors. Here you will find a wide range of tools to discuss, debate, blog, post, chat and otherwise communicate with others who share your interest in the markets.
© 2009 Copyright Steven Vincent - All Rights Reserved Disclaimer: The above is a matter of opinion provided for general information purposes only and is not intended as investment advice. Information and analysis above are derived from sources and utilising methods believed to be reliable, but we cannot accept responsibility for any losses you may incur as a result of this analysis. Individuals should consult with their personal financial advisors.
© 2005-2022 http://www.MarketOracle.co.uk - The Market Oracle is a FREE Daily Financial Markets Analysis & Forecasting online publication.