Seasonal Pattern Points to Higher Oil Prices in Late Summer
Commodities / Crude Oil Jun 20, 2007 - 01:14 AM GMTBy: Donald_W_Dony
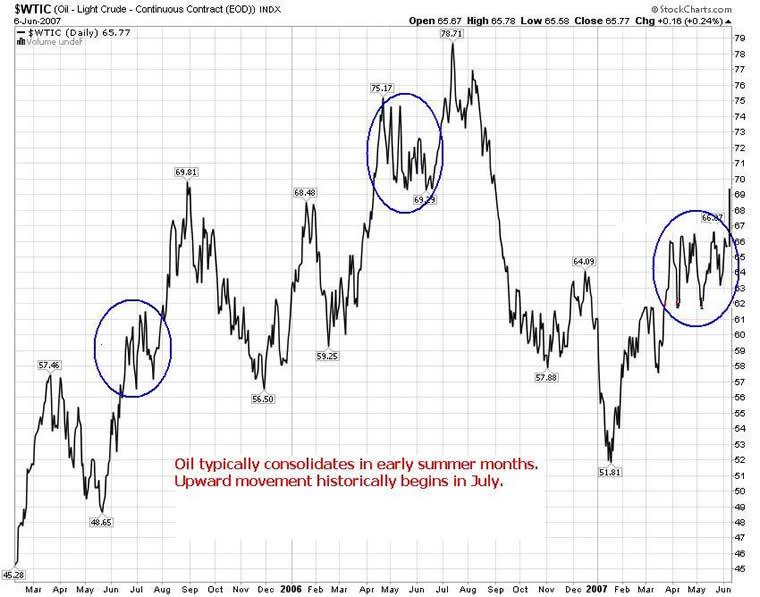
 Oil has traded over the past five years with a distinct seasonal pattern. There is an annual low in December or January and a price peak in August or September. But along the path to the top, this commodity often consolidates during April, May and June. The trading action in 2007 is matching exactly this pattern.

After an annual low of $51.81 in January 2007, oil (Chart 1) advances steadily up to the $67 resistance level where it consolidated for three months. Recent trading has seen this commodity move over this line with good open interest volume. Oil can be expected to stall under the $70 resistance level short-term before continuing to its peak in August or September. As there are 2-3 months remaining before the seasonal top, this commodity can be anticipated to advance to the mid-$70s before beginning its usual decent in the 4th quarter and annual low.
Fundamental concerns of insufficient supply prior to the U.S. summer driving season and looming Middle Eastern concerns have kept mounting upward pressure on oil.

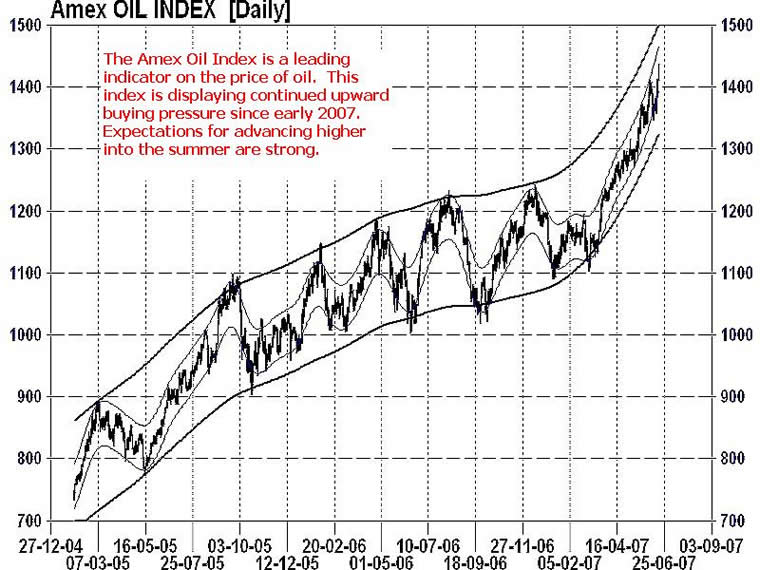
Chart 2 illustrates the expectations from the market for higher commodity prices. The Amex oil Index is a leading indicator on the spot price of oil. This is because the Index moves with anticipation of the commodity. After a breakout from consolidation in late February 2007, the Amex has continued to climb to new highs. Though the price of the Index is currently overbought, higher numbers are expected in August.
INTERMARKET PERSPECTIVE: Rising oil prices eventually have a dampen effect on the consumer and ultimately on the economy. As more funds are required to pay energy costs, less capital is available to the consumer to purchase goods. Rising oil prices also signal inflationary pressures are still building which can influence interest rates.
MY CONCLUSION: Oil can expect to climb to higher prices over the next 8-10 weeks as normal seasonal demand pressures unfold. This should provide the stimulus to keep energy stocks advancing throughout much of the summer and into August or September.
Your comments are always welcomed. More information on the trading pattern of oil and natural gas will be found in the upcoming July technical Speculator newsletter.
By Donald W. Dony, FCSI, MFTA
www.technicalspeculator.com
COPYRIGHT © 2007 Donald W. Dony
Donald W. Dony, FCSI, MFTA has been in the investment profession for over 20 years, first as a stock broker in the mid 1980's and then as the principal of D. W. Dony and Associates Inc., a financial consulting firm to present. He is the editor and publisher of the Technical Speculator, a monthly international investment newsletter, which specializes in major world equity markets, currencies, bonds and interest rates as well as the precious metals markets.
Donald is also an instructor for the Canadian Securities Institute (CSI). He is often called upon to design technical analysis training programs and to provide teaching to industry professionals on technical analysis at many of Canada's leading brokerage firms. He is a respected specialist in the area of intermarket and cycle analysis and a frequent speaker at investment conferences.
Mr. Dony is a member of the Canadian Society of Technical Analysts (CSTA) and the International Federation of Technical Analysts (IFTA).
© 2005-2022 http://www.MarketOracle.co.uk - The Market Oracle is a FREE Daily Financial Markets Analysis & Forecasting online publication.


