Increased Liquidity Boosts Economic Recovery Hopes
Economics / Economic Recovery Sep 07, 2009 - 02:00 AM GMTBy: Lloyds_TSB
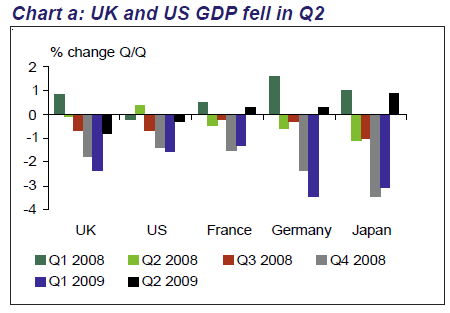
 Global economic recovery gets underway - A global increase in liquidity has been underway in an attempt to kick start economic recovery ever since the depth of the financial crisis was understood. It appears to be working. A range of countries have recorded a rise in economic growth in Q2, including Germany, France and Japan, see chart a. For many of them, this was the first rise in economic activity in over a year, after sharp consecutive quarterly declines.
 However, the US and the UK recorded falls in economic activity in Q2. It is also noticeable that emerging market economies are bouncing back more quickly than developed economies, with annual gdp in Q2 up by 7.9% in China, by 6.1% in India and quarterly increases in Singapore of 20% and 9.7% in South Korea. In short, there are solid signs that conventional and unconventional policy loosening is helping to foster a global economic recovery.
US and UK economies still in recession but set to expand in Q3…
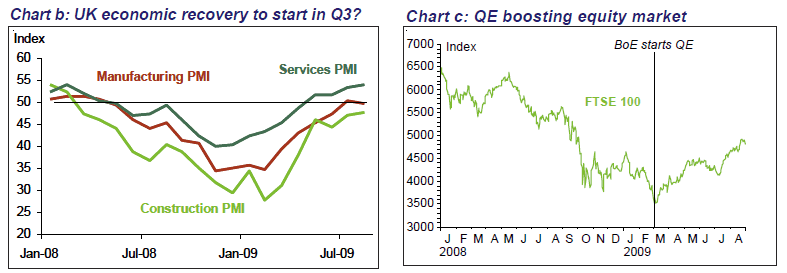
The predominant message from recent economic data in the US and the UK is that both economies are likely to exit recession in Q3. Focusing just on the UK, there was a rise in the services Purchasing Managers Index (PMI) for July to 54.1, up for the fourth month in succession and the highest level since September 2007. Although the manufacturing PMI fell from 50.2 to 49.7, and the construction PMI was 47.7 (up from 47.0 in June), the weighted average of the three PMI’s (based on their shares of gdp) was 53.7 in July and so suggests that the economy will expand in Q3, see chart b. A similar story can be told for the US, albeit less based on the services ISM than on the manufacturing ISM and other indicators.
...aided by injections of liquidity from the public sector, which is also boosting financial markets…
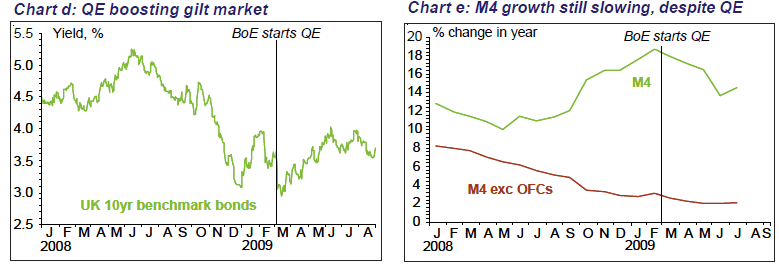
It is also increasingly evident, however, that the increase in public sector liquidity is not only helping to restart economic growth but is also boosting financial markets. Using the UK as an example, since quantitative easing began in March 2009, financial market activity has generally shown a steep rise. Take the FTSE 100, which is up by about 40% from its March low, see chart c. Is it just a coincidence that the rise started from the time that the Bank of England (and Fed) initiated quantitative easing (QE)? Sterling corporate bond issuance has also surged, and the yield on investment grade bonds has fallen by about 2 percentage points, to 6% or so since QE. Government bond yields have also fallen back recently, as QE has put a rising share of the amount of gilts outstanding into the Bank of England’s hands, after rising initially on worries about price inflation, see chart d. Incidentally, the QE programme may also explain the seeming conundrum of rising equity prices and falling or low gilt yields.
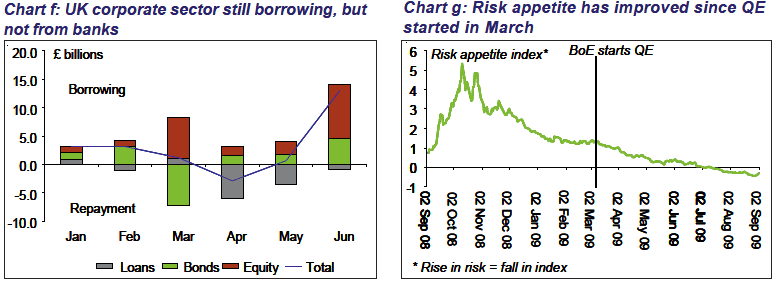
Taken together, or even separately, these trends suggest that investors have switched cash from selling gilts to the Bank of England into equities and bonds. This has enabled corporate issuers in these markets to take advantage of the increased demand to sell new equity and bonds. This is of course good news for the economy. It implies fewer bankruptcies, less financial problems and more investment than otherwise (less cutbacks in spending), meaning lower unemployment and so less economic distress. To that extent, it means that QE is helping economic recovery in a broader sense. However, as the chart shows, some of the borrowing by companies from the capital markets is being used to repay bank loans, see chart f. It seems therefore that recent debt issuance is predominantly a balance sheet restructuring exercise by firms – vital though that may be – rather than a way of raising finance to boost investment spending, as shown by the record fall of 10.4% in business investment in Q2.


…leading to more willingness to take risks, indicating a rise in confidence and lower financial market stress…
Financial market confidence is also being reflected in a rise in the willingness of participants to invest in riskier assets. Our Lloyds TSB Corporate Markets Risk Appetite Index (RAI) - which measures returns and volatility on various asset classes - shows that there has been such a sharp rise in the willingness to place funds in higher yielding instruments that the index has fallen into negative territory. (A fall in the index represents a rise in risk appetite). A negative outcome for the index simply means that the willingness to get out of safe, lower yielding assets, into riskier more volatile but higher yielding assets, is the highest it has been since July 2007. In short, financial market stress has fallen sharply since QE was initiated – also one of its aims.
…but the central bank may still have to maintain its current loose monetary stance to ensure economic recovery
But the Governor of the Bank of England has said that the main aim of QE is to increase M4 money supply, and this has not happened – or, more accurately, it has not happened yet, and could hence require more QE than the £175bn so far announced, to ensure that it does. Debt repayment or deleveraging by households and companies still seems to be occurring, however, in spite of QE. Households repaid consumer debt in July, the first time this has happened since the records began to be kept on this basis in 1993. Companies repaid debt as well, amounting to £8.4bn in July, a fall of 1.7% in bank lending to firms that month and the biggest decline since 1997.

Trevor Williams, Chief Economist, Corporate Markets
For more information: Emile Abu-Shakra Manager, Media Relations Lloyds TSB Group Media Relations Tel 020 7356 1878 http://www.lloydstsbcorporatemarkets.com/
Lloyds TSB Archive |
© 2005-2022 http://www.MarketOracle.co.uk - The Market Oracle is a FREE Daily Financial Markets Analysis & Forecasting online publication.


