Analysis of the Seasonal Variations in the Price of Gold
Commodities / Gold & Silver Jun 20, 2007 - 06:10 PM GMTBargain Buying: Use Seasonal Price Trends to Your Advantage USAGOLD-Centennial Precious Metals
One of the more intriguing curiosities of the current bull market in gold has to do with the annual buying opportunity which seems to crop up in the depths of the summer doldrums.
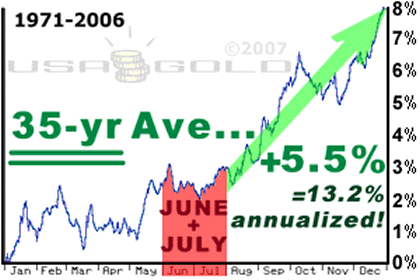
 To make a long story short, gold purchases made in June and July proved very profitable by year-end, as shown in the annual price charts (see right) and explained by our following evaluation.
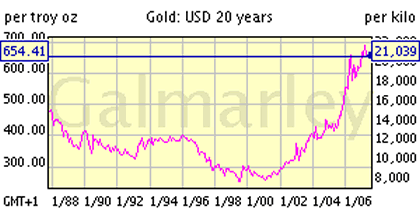
As depicted in the graph below, the end of a 20-yr bear market in gold was marked in 1999, and this new bull market birthed in 2001.

20 Year Gold Price Chart;
Secular Bear Becomes Secular Bull
In focusing especially upon the particular consistencies revealed during each of these past six bullish years of the new trend we can snatch some semblance of order and direction amidst the general noise.
Our first observation is that despite straddling the very middle of the year, pricing patterns in June and July have nonetheless, with near perfect consistency, allowed investors the very latest-possible opportunity to buy gold at levels still below the average annual price for that year.
And the key point here is that one needn't attempt to further refine their weekly or daily timing of action beyond that which is obtained by blind action -- meaning, any random assortment of purchases throughout June and July on average proves to be a fruitful maneuver by year-end.
The simplicity of this seasonal trend is a useful insight for bargain hunters. In fact, over the past 35 years , this trend holds on average, and over two-thirds of the average annual gains have been registered between August and December.

For the most-recent six years , subsequent seasonal price-gains registered from August until year-end for any random assortment (i.e., average) of gold purchases made during these special two doldrum months of June and July, as demonstrated from 2001 through 2006, have averaged 10.6 percent -- representing an impressive 25.4 percent when annualized for the remainder of the year .
This certainly turns that old Wall Street adage, "to sell in May and go away," completely on its ear.
The accompanying annual price charts tell the graphic story (see right)...
Update by Randal Strauss and Jonathan Kosares for USAGOLD - Centennial Precious Metals, Denver
By Michael J. Kosares
We invite you to join the USAGOLD NewsGroup .
Important events and analysis by e-mail including our Market Updates. Free
Mr. Kosares is the owner and founder of Denver, Colorado based gold firm USAGOLD-Centennial Precious Metals Inc. He is the author of the widely read "ABC's of Gold Investing: How to protect and build your wealth with gold."
Disclaimer: when considering any market analysis, bear in mind that past trends do not necessarily guarantee future performance.
Michael J. Kosares Archive |
© 2005-2022 http://www.MarketOracle.co.uk - The Market Oracle is a FREE Daily Financial Markets Analysis & Forecasting online publication.


