FTSE 100 Hits 2009 Stocks Bull Market Target of 5000, What's Next?
Stock-Markets / UK Stock Market Sep 10, 2009 - 01:55 AM GMTBy: Nadeem_Walayat
 The FTSE 100 stock market index broke above 5,000 by closing at 5,004 for the first time since the financial collapse of September 2008.
Whilst the highly vocal public perma bears have frightened much of the investing public into sitting on the sidelines, too frightened to commit and leaving the smart money to accumulate at rock bottom prices, readers following my analysis of the stealth stocks bull market will have been left with little doubt of where I expected the market to head with first a clear target for the bear market bottom at the start of the year confirmed in March, and then the subsequent stealth bull market mapped out throughout 2009 as the following illustrate before I get to where I expect the FTSE is headed to next.
Whilst much of my analysis has been focused on the Dow Jones Index, however as I have stated several times over the year that the FTSE would closely track the DJIA in terms of market timing, but with a more positive trend advantage to the Dow Jones Index.
FTSE 100 Index Forecast (20th Jan 09 - FTSE 4091)
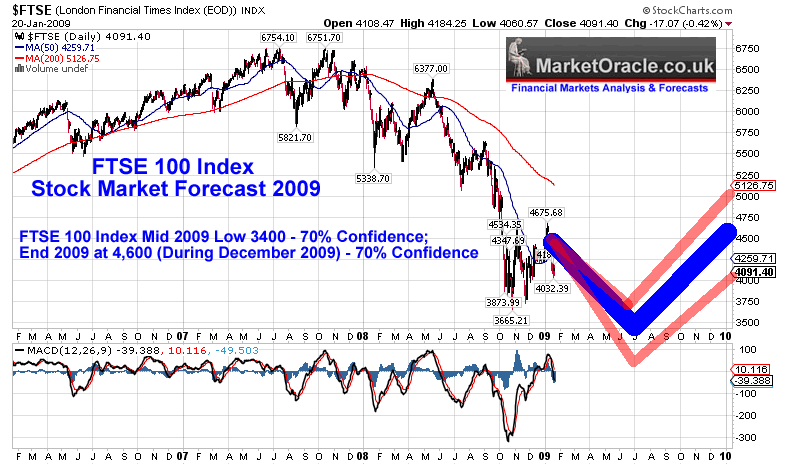
"The FTSE looks set to break below the previous low, however I expect the FTSE to outperform other indices with a minimum 35% move from the years low and finish Up on the year, my best estimate at this time is for the FTSE to trade at 4,600 or higher during December 2009. Also I am expecting that 2009 will mark the start of a multi-year bull market that will eventually make 2008-2009's price action appear as a mere minor blip, much as the 1987 crash appears on today's price charts."
Dow Jones Index Bottom? - 8th March 2009 - DJIA 6626, FTSE 3520
"Having now fulfilled the primary target of 6,600 the next phase of the strategy is therefore towards accumulating on buy price triggers in advance of what I consider will become a multi-year bull market, which appears contrary to many analysts."
Dow Jones Stealth Bull Market Born - 15th March 2009 - Dow 7224, FTSE 3,770
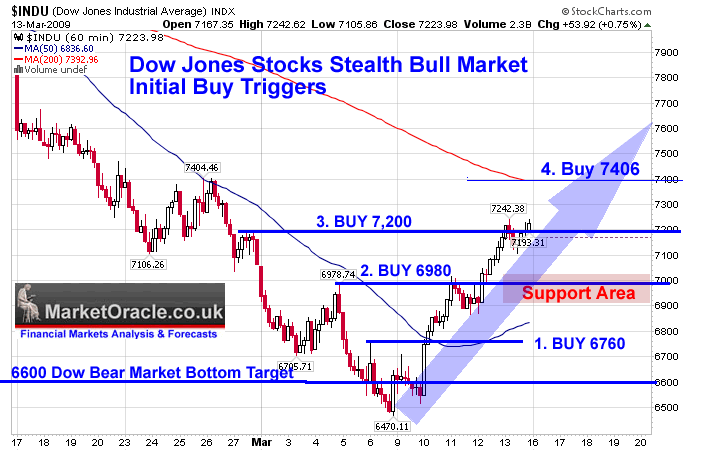
"As stated in last weekends analysis and newsletter , following the Dow's Friday close at 6626 that the Dow Jones Index had now fulfilled its bear market target of 6,600 as per the analysis of 20th Jan 2009 and illustrated by the chart below. The primary focus hence forth was to "position for a bullish spike higher" that would CONFIRM the bear market low, and negate the secondary far less probable overshoot target of 5,700 to 6000. This occurred on Tuesday which saw the first of a series of BUY TRIGGERS both on the Intra day charts and then on the Daily time frame chart that confirmed the preceding weeks Bear Market Low and set in motion the anticipated spike that took the Dow up 12% by the end of the week to close at 7,224. "
FTSE 100 Index Stealth Bull Market as Bear Market Bottoms at 3,460 - 17th March 2009 - FTSE 3860
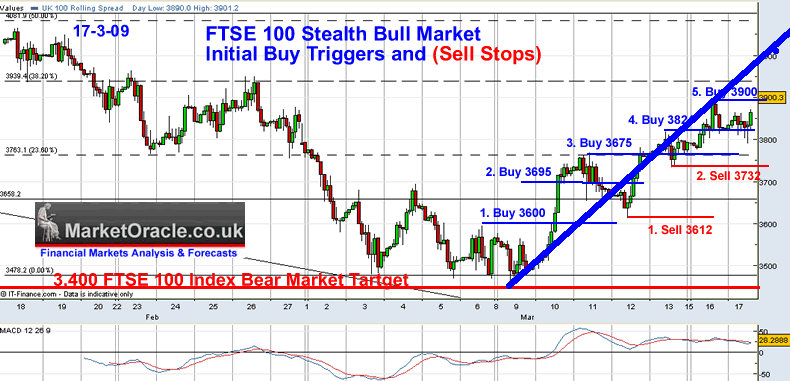
Initial Bull Market Target 30% Advanced, revised during April Dow analysis to 50% for 2009 or FTSE 4995
More Recent Dow Analysis mapped out the trend for the Dow Jones Index as follows -
The stocks bull market continues to resolve towards the pattern I painted some 7 weeks ago - Vicious Stocks Stealth Bull Market Eats the Bears Alive!, What's Next?
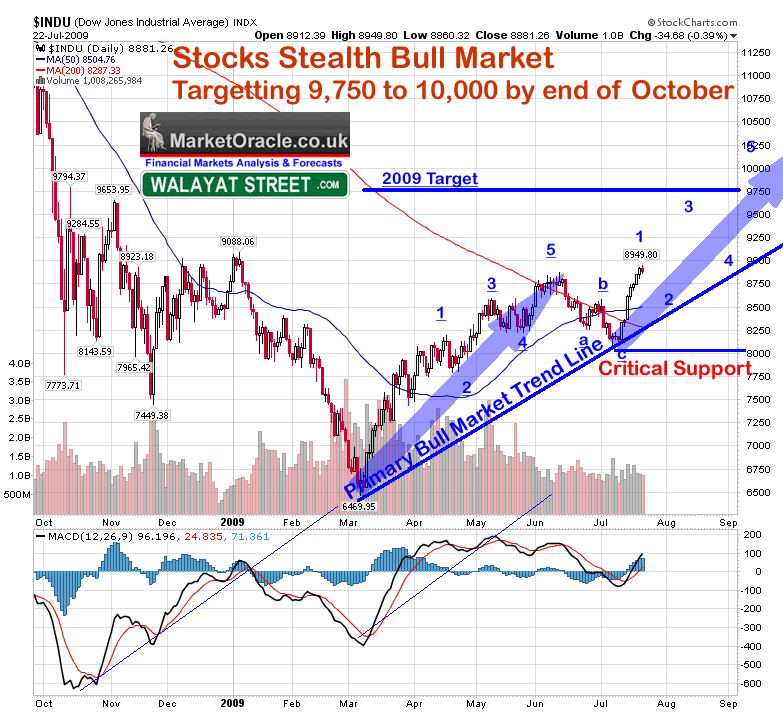
CONCLUSION - My earlier fears about a bull trap appear to be unfounded, the stock chart is talking that we are in a stocks bull market, and is suggestive of a trend higher towards a 2009 target of between 9750 and 10,000, with a high probability that we may get there before the end of October!. Key danger areas for this scenario are a. for the trend line to contain corrections, and b. that 8080, MUST HOLD.
The last update of 3 weeks ago (Stocks Stealth Bull Market Crushes Bears Hopes Again) showed the trend resolving towards an earlier peak given the strength of wave 1 which implied a weaker waves 3 and 5.
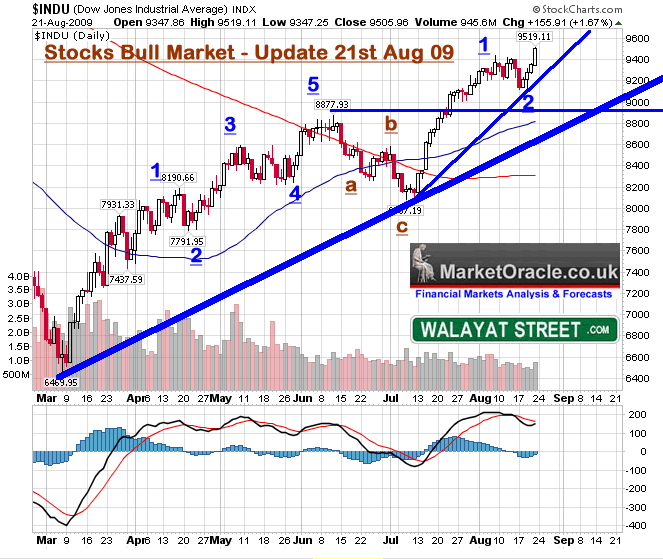
The Price action to date has shown relative strength against the forecast of a month ago, this suggests a higher target than the original 9750 to 10K before the end of Oct 2009, the secondary stated target was 10,450. However it also suggests that the market may put in an earlier peak. I am still leaning towards the next correction AFTER the peak to be of greater significance than the last correction from June to July. Also, whilst my in depth economic analysis is on the UK economy, however much of the conclusions could equally be applied to other western economies, the analysis of February 2009 has been projecting towards a a DOUBLE DIP recession (updated June 09) which has negative implications for stocks during 2010, but for now DON'T be silly, don't fight the stocks bull market (time to drop the word stealth).
The Crumbliest Flakiest Stocks Bull Market Never Tasted Before - Sept 7th 2009
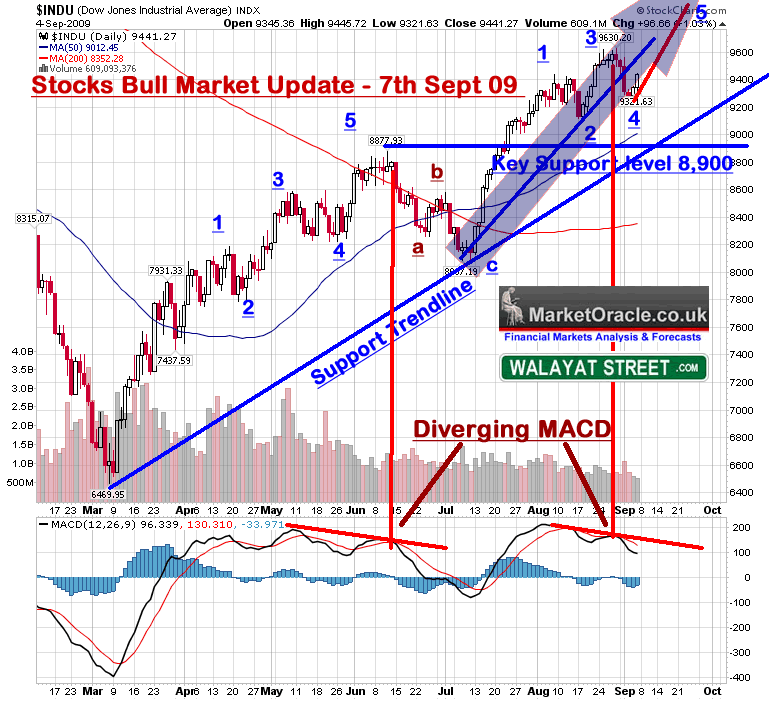
The target for the termination of the current phase of the bull market rally was between 9750 and 10,000. As mentioned above, I am not expecting an easy ride for the fifth wave as clearly it is an obvious pattern to interpret following waves 1,2,3,4. What does this mean ? Well wave 3 is screaming weakness, so that suggests a weak push higher rather than something that resembles wave 1.
The MACD is also signaling serious price weakness as there is clear divergence taking place between the rising trend and a falling MACD, very similar to the June peak.
Two possible outcomes -
a. That the fifth puts in a lower peak than the wave 3, which is significantly more bearish.
b. That we get some sideways drift (possible false break lower) before a sharp rally for a higher fifth into the target zone.
Despite the increasingly bearish technical indicators at this point I continue to march with the bull market and favour outcome b. ahead of a more serious correction that would first 1. target target the main support trendline and 2. 8900 Previous Peak.
FTSE 100 Index, Where Next?
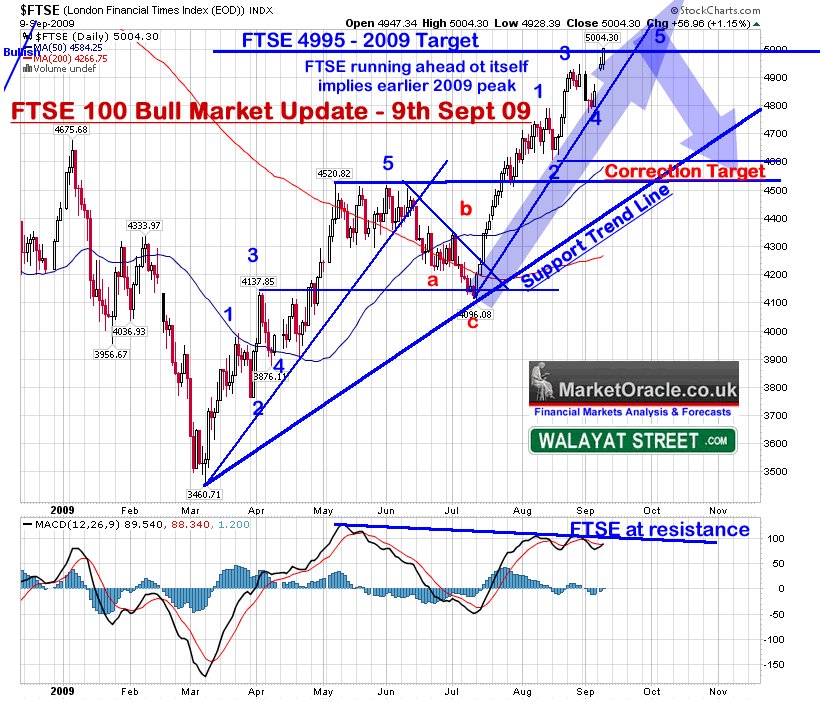
The FTSE 100 index as originally anticipated at the start of the year is showing relative strength against the Dow Jones, this is most evident in the fact that the FTSE has achieved its price target for 2009 of 5,000 ahead of schedule by several weeks, whereas the Dow Jones remains several hundred points short of its target range of between 9,750 and 10,000.
The elliott wave pattern shows that the FTSE has broken above the wave 3 peak and is into its final fifth towards a new high which is ahead of schedule against a projected termination point for this rally of early October. What this suggests is that the FTSE could drift sideways for several weeks waiting for the DJIA to play catchup i.e. I see very limited upside remaining in the FTSE for the rest of this year!
In fact the FTSE is primed to undergo a serious correction the timing of which will be on alignment with other major global stock indices i.e. the DJIA.
Therefore I anticipate a much more difficult time for the FTSE for the rest of the year, i.e. Despite being a stocks bull, I would be surprised if the momentum of the past 2 months continues. More Probable is that the FTSE will undergo a serious correction towards a target of 4,500 to 4650 as indicated by the above chart.
In Summary, the FTSE 100 Index has FULLFILLED ITS 2009 Bull market Target of 5,000 and is primed for an IMMINENT SERIOUS CORRECTION, the only delay of which is in alignment with other global indices.
Your stock index trading analyst.
Ensure you are subscribed to my always free newsletter to be kept upto date on the stocks bull market.
By Nadeem Walayat
http://www.marketoracle.co.uk
Copyright © 2005-09 Marketoracle.co.uk (Market Oracle Ltd). All rights reserved.
Nadeem Walayat has over 20 years experience of trading derivatives, portfolio management and analysing the financial markets, including one of few who both anticipated and Beat the 1987 Crash. Nadeem's forward looking analysis specialises on the housing market and interest rates. Nadeem is the Editor of The Market Oracle, a FREE Daily Financial Markets Analysis & Forecasting online publication. We present in-depth analysis from over 300 experienced analysts on a range of views of the probable direction of the financial markets. Thus enabling our readers to arrive at an informed opinion on future market direction. http://www.marketoracle.co.uk
Disclaimer: The above is a matter of opinion provided for general information purposes only and is not intended as investment advice. Information and analysis above are derived from sources and utilising methods believed to be reliable, but we cannot accept responsibility for any trading losses you may incur as a result of this analysis. Individuals should consult with their personal financial advisors before engaging in any trading activities.
Nadeem Walayat Archive |
© 2005-2022 http://www.MarketOracle.co.uk - The Market Oracle is a FREE Daily Financial Markets Analysis & Forecasting online publication.


