


Gold and Silver Price Forecast of $1,150 and $30
Commodities / Gold & Silver 2009 Sep 12, 2009 - 05:43 AM GMTBy: Madison_Avenue_R

 Long Term: Madison Avenue Research Group's outlook for gold and silver is bullish. Our sentiments echo Peter Barnes, CEO of Silver Wheaton whom in a BNN interview on September 8, 2009 said "Over the next two or three years silver is going through USD$30/oz”. Barnes believes weakness in the US dollars will drive precious metal prices and excessive monetization will have a significant inflationary effect at some stage saying "it is only a matter of when".
Near Term: The near term floor for gold is US$950/oz and the long-term support level is US$860/oz. Given the psychological importance of $1,000, a close above this level on a daily and weekly basis will be important to the sustainability of this rally. With the dollar under pressure and other markets possibly on borrowed time at these high levels, some of the smart money may well be moving out of those asset classes that have done well and which now appear overpriced into the safety that bullion offers. The metal reached a record $1,033.90 on March 17, 2008 and it would not surprise many to see fresh record highs on gold shortly. Investec Asset Management said in a report on September 9, 2009 that gold may climb as high as $1,150 an ounce as the dollar weakens, boosting the potential for inflation to accelerate, and as investors sell energy assets to buy precious metals.
Recent development of significance - 'Barrick Unwinds Hedges': Barrick Gold Corp., the world's largest gold producer, announced plans this week to eliminate fixed-price forward gold-sales contracts, or hedges, as it bets that bullion will climb. The company said it had contracts for 9.5 million ounces of gold as of Sept. 7. Barrick will record $5.6 billion in third-quarter costs related to unwinding forward contracts. In and of itself, the announcement will not necessarily push gold prices to the next plateau, but it is a significant declaration for Barrick and its new CEO to communicate, namely that the company sees the price of gold as going higher. The move will be facilitated with a massive bought-deal financing, the largest primary common-equity offering in its home country's history.
Seasonal Influences
Traditional gold and silver bull season has only just begun;
1) Gold has a period of seasonal strength from July 12 to October 9th (the trade has been profitable 18 of the past 24 periods).
2) A period of seasonal strength also exists from the first week of November to the first week in February (a trade that has been profitable in 8 of the last 10 periods) for an average gain per period of 13.9%.
Figure 1. Average Returns in Spot Gold Over the Last Four Decades
Precious Metals Equities: The Philadelphia Gold and Silver Index (^XAU) has a period of seasonal strength from July 27 to September 25 and has been profitable in 16 of the past 24 periods, outperforming the S&P 500 by an average of 8.4% per period. In the first week of November to the first week of February the Philadelphia Gold and Silver Index has advanced in 7 of the past 10 periods for an average gain of 9.5%
|
 The HUI gold-stock index (A.K.A. AMEX GOLD BUGS INDEX HUI) offers an excellent measure to gauge the gold-mining industry, the 15 miners that comprise the HUI are as follows (BARRICK GOLD CORP. ABX, AGNICO EAGLE MINES AEM, YAMANA GOLD INC AUY, COMPAÑÍA DE MINAS BUENAVENTURA SA BVN, COEUR D'ALENE CP CDE,
Review of Top Senior Gold Producers
Gold prices are well above cost of production and many major producers are throwing off large amounts of free cash, have vast reserves, and are still at attractive prices relative to the potential they hold as a hedge against where the dollar they are denominated in may be heading in the long run. As the price of gold rises, positively leveraged gold producers should be well-positioned to earn handsome returns for their shareholders as they derive higher prices for their gold. Below is a review of the top ten gold producers in ascending order of ounces produced. Source Market Equities Research Group Q3 Summer Resource Book and subject company websites/corporate presentations:
First place) Barrick Gold Corp. (NYSE: ABX)(TSX: ABX) Production of 7.2 - 7.6Moz at total cash cost of US$450-475/oz and guidance of 7.7-8.1Moz in 2010. Barrick is the world's largest gold company in terms of market capitalization, annual production, and reserves. The company reported reserves of 138.5Moz at the end of 2008. Current growth projects include Buzwagi, Cortez Hills, Pueblo Viejo, and Pascua-Lama.
Second place) Newmont Mining Co. (NYSE: NEM) 2009 gold sales guidance is 5.2-5.5Moz at costs of $400-440/oz. Newmont is the world's second-largest gold company in terms of production. Yanacocha and Nevada remain Newmont's foundation, but it operates in most other gold-producing regions, including Australia, Canada, Indonesia and most recently West Africa. Reserves were 85.0Moz at December 31, 2008.
Third place) AngloGold Ashanti Ltd. (JSE: ANG)(NYSE: AU) The company forecasts gold production of 4.9 - 5.0Moz in 2009 at cost of US$450-460/oz using R9.25/US$ and US$460-475/oz at R8.50/US$. AngloGold Ashanti is a global gold producer domiciled in South Africa. Production is sources from Africa, Australia and the Americas. Reserves were 74.9Moz at year-end 2008.
Fourth place) Gold Fields Ltd. (JSE: GFI)(NYSE: GFI) the company is targeting a 4Moz per year run rate. Gold Fields Ltd. is a senior gold producer with roughly two-thirds of its production sourced from South Africa. It also has assets in West Africa, South America and Australia.
Fifth place) Goldcorp Inc. (NYSE: GG)(TSX: G) The company states that over the next five years Goldcorp’s production will increase by over 50%; a growth unparalleled in the gold mining industry. Gold production for 2009 is estimated at 2.3 million ounces at a total cash cost of $365 per ounce. Strategy for growth is predicated on strong focus on organic growth, no gold hedging, low cost gold producer, maintain a strong balance sheet, focus on low political risk jurisdictions, $95 million exploration budget for 2009.
Sixth place) Freeport McMoRan Copper & Gold Inc. (NYSE: FCX) Projected production in 2009 is 2.3Moz of gold, 50Mlb of molybdenum, 3.9Blb copper (with targeted by-product cash cost of US$0.70/lb). Freeport-McMoRan Copper & Gold, Inc. engages in the exploration, mining, and production of mineral properties primarily in Indonesia, North America, South America, and Africa. It focuses on the copper, gold, molybdenum, and silver prospects; FCX is a market proxy for copper. The 2007 Phelps acquisition diversified the business, but Grasberg remains the key generative asset.
Seventh place) Harmony Gold Mining Co. Ltd. (JSE: HAR)(NYSE: HMY) ~2.2 Moz annual gold production. Through mergers and acquisitions, Harmony has become a significant South African gold producer. The company is restructuring its asset portfolio around core operations in South Africa and growth projects in Southeast Asia.
Eighth place) Kinross Gold Corp. (NYSE: KGC)(TSX: K) ~1.58Moz annual gold production from what Market Equities Research Group determined for 2008, a review of the corporate website only shows "gold-equivalent" production guidance is 2.4-2.5Moz at average costs of US$390-420/oz. Kinross is a senior gold producer with operations located in North America, Brazil, Chile and Russia. The company commissioned the Kupol mine in Russia, and is completing the Paracatu expansion in Brazil and the Buckhorn project in the United States. At December 31, 2008 reserves were 45.6 Moz.
Ninth place) Newcrest Mining Ltd. (ASX: NCM) Newcrest expects total fiscal 2009 production of 1.63-1.70Moz gold and 85-88kt copper. Management expects Telfer gold production of 700,000-750,000oz in fiscal 2009 compared to 590,217 in fiscal 2008. Production for fiscal 2009 at Gosowong is expected to remain flat at 400,000-415,000oz of gold, while Cadia Valley is forecast to decease to 520,000-540,000oz of gold from 715,588oz in fiscal 2008. Total copper production is forecast at 85,000-88,000t. Key operations are located in Australia and Indonesia. The company has an extensive development pipeline, including Cadia East, Ridgeway Deeps and Kencana.
Tenth place) Rio Tinto Plc (LSE: RIO)(NYSE: RTP) ~1.23 Moz annual gold production is what was referenced by Market Equities Research Group for 2008 -- Rio Tinto is a diversified metals and mining company and produces gold and silver primarily as by products of their copper operations. The company is the world's second largest producer of iron ore and coal, the third-largest producer of uranium and gem-quality diamonds, the fourth-largest copper producer and the largest aluminum producer. It is also the world's largest producer of bauxite, titanium dioxide slag, borates and talc, and the largest exporter of industrial salt
Insight on Jr. Miners
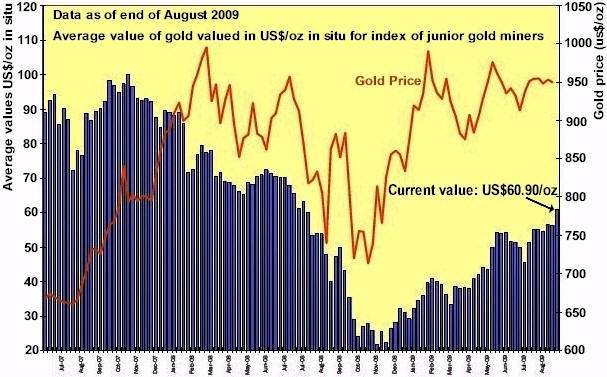
Figure 2: Gold price versus average value US$/oz in situ Weighted average and ratios used; Canadian$ : US$ conversion = 0.91, Gold : Silver ratio = 64:1, shares outstanding were as of available Q1 2009 numbers
The chart to above compares 'the average value of gold in situ for an index of junior/mid-tier gold miners' to 'the price of gold'. The chart clearly shows the growing divergence and offers a bullish signal to junior mining equity investors as the equities are justified in upward price revaluation relative to the price of the commodity.
Values were engineered from index data comprised of components that may be seen in an expanded version of this report at http://madisonaveresearch.com/topgold2009.htm online
By James O’Rourke and Joseph Williams, Madison Avenue Research Group
http://madisonaveresearch.com/topgold2009.htm
© 2009 Copyright Madison Avenue Research Group- All Rights Reserved
Disclaimer: The above is a matter of opinion provided for general information purposes only and is not intended as investment advice. Information and analysis above are derived from sources and utilising methods believed to be reliable, but we cannot accept responsibility for any losses you may incur as a result of this analysis. Individuals should consult with their personal financial advisors.
© 2005-2022 http://www.MarketOracle.co.uk - The Market Oracle is a FREE Daily Financial Markets Analysis & Forecasting online publication.